最近因为要研究一个算法的优化问题,需要找一款工具对程序进行性能分析,于是想到了google的性能分析工具gperftools的CPU profiler,本文记录CPU profiler的使用心得。
编译安装gperftools
gperftools是一个工具包,CPU profiler是其中的工具之一,用于程序性能分析。要使用CPU profiler就要先编译安装gperftools,下面是简单的编译安装过程.
# 从github下载gperftools源码并解压
wget https://github.com/gperftools/gperftools/archive/gperftools-2.7.tar.gz
tar xvf gperftools-2.7.tar.gz
# 解压文件夹改名
mv gperftools-gperftools-2.7 gperftools-2.7
cd gperftools-2.7
./autogen.sh
./configure
make -j8
# 安装到系统文件夹
sudo make install
注意:在64位操作系统下需要libunwind支持,如果没有安装libunwind,还要先编译安装libunwind。
使用cpu profiler
根据CPU profiler的官方说明(
https://gperftools.github.io/gperftools/cpuprofile.html
),对一个程序进行测试是很简单的。
只要加上
-lprofiler
对程序重新编译一次,再执行程序就可以了,如下是官网给出简单步骤:
# 加上-lprofiler编译自己的程序
gcc [...] -o myprogram -lprofiler
# 设置环境变量CPUPROFILER指定生成的性能报告文件,并执行自己的程序
CPUPROFILE=/tmp/profile ./myprogram
这个简单办法,不需要修改自己的程序,但我一直没有尝试成功,不能生成性能报告文件(如果有朋友知道为什么,请不吝赐教),最终还是通过修改自己的程序,在程序开始和结束位置分别加入
ProfilerStart,ProfilerStop
函数才解决。示例如下:
#include <gperftools/profiler.h>
....
int main(int argc, const char* argv[])
{
	ProfilerStart("test_capture.prof");
	.....
	ProfilerStop();
}
因为在代码中加入了
ProfilerStart
函数指定了生成性能报告的文件名,所以在执行程序时就不一定需要
CPUPROFILE=/tmp/profile
再指定性能报告文件名。
程序运行结束会在当前文件夹生成名为
test_capture.prof
的性能报告。
性能报告
有了性能报告 ,就可以用gperftools提供的性能分析工具
pprof
生成直观可读的文件形式。
browser
# 生成性能报告(层次调用节点有向图)输出到web浏览器显示
# 第一个参数为你的可执行程序或动态库文件名,第二个参数为上一步生成的性能报告文件
pprof  ./test_capture test_capture.prof --web
下面的图形输出报告中,大字体显示的节点就是CPU使用率的’热点’,一目了然。
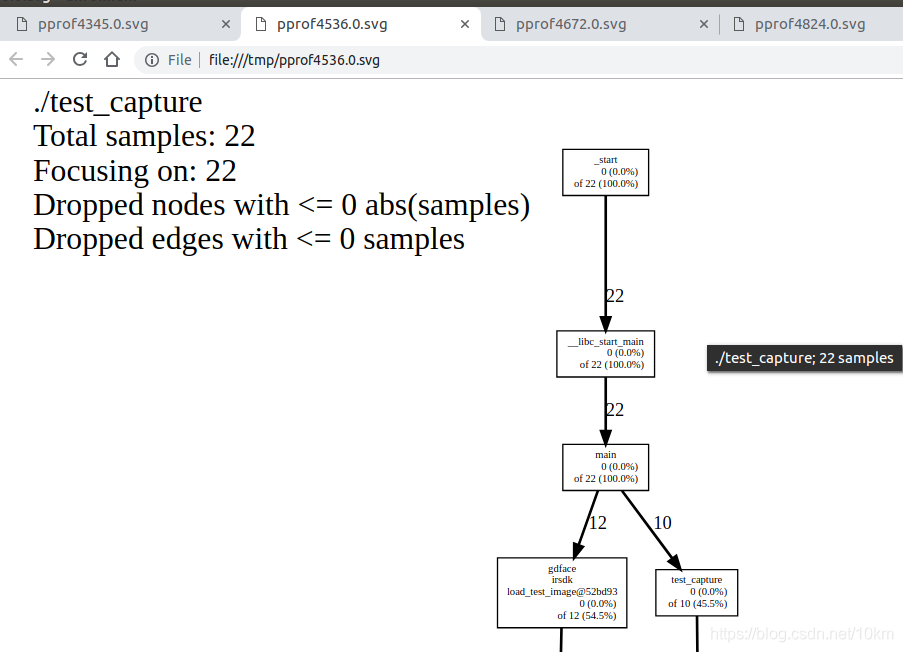

节点信息说明
图形风格的性能报告由节点和有向边组成, 每个节点代表一个函数,节点数据格式:
| 字段名 | 描述 |
|---|---|
| Class Name | 类名,非类成员函数此项为空 |
| Method Name | 函数名 |
| local (percentage) | 当前函数直接执行的指令所消耗的CPU时间(包括内联函数)(百分比) |
| of cumulative (percentage) | 当前函数的local时间及其调用的函数的local时间总和(百分比),如果与local相同,则不显示 |
有向边:调用者指向被调用者,有向边上的时间表示被调用者所消耗的CPU时间
性能分析通过抽样方法完成,默认是1秒100个样本,一个样本是10毫秒,即时间单位是10毫秒;可以通过环境变量
CPUPROFILE_FREQUENCY
设置采样频率。
更多详细说明参见
CPU profiler
Node Information
一节
pdf
# 生成pdf格式的性能报告(层次调用节点有向图)
pprof  ./test_capture test_capture.prof --pdf > prof.pdf
text
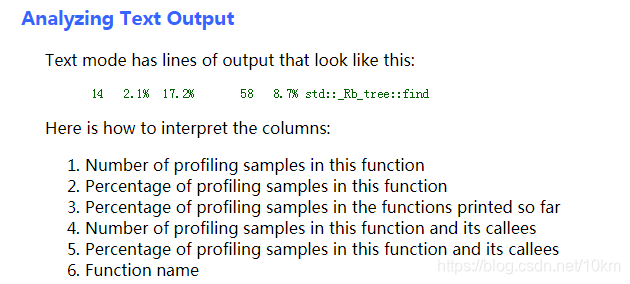
# 生成文本格式的性能报告输出到控制台
./test_capture test_capture.prof --text
输出内容如下,在CPU使用率降序输出所有的函数名:
Using local file ./test_capture.
Using local file test_capture.prof.
Total: 20 samples
       4  20.0%  20.0%        4  20.0% CanFaceCcd
       4  20.0%  40.0%        4  20.0% cimg_library::CImg::RGBtoYUV
       3  15.0%  55.0%        5  25.0% cimg_library::CImg::CImg
       2  10.0%  65.0%        2  10.0% StepImageHalfNormal
       2  10.0%  75.0%        2  10.0% __nss_passwd_lookup
       2  10.0%  85.0%        2  10.0% decode_mcu
       1   5.0%  90.0%        1   5.0% GetIntegralOfIma
       1   5.0%  95.0%        1   5.0% RunCascade
关于上面各个字段的意义参见
https://gperftools.github.io/gperftools/cpuprofile.html
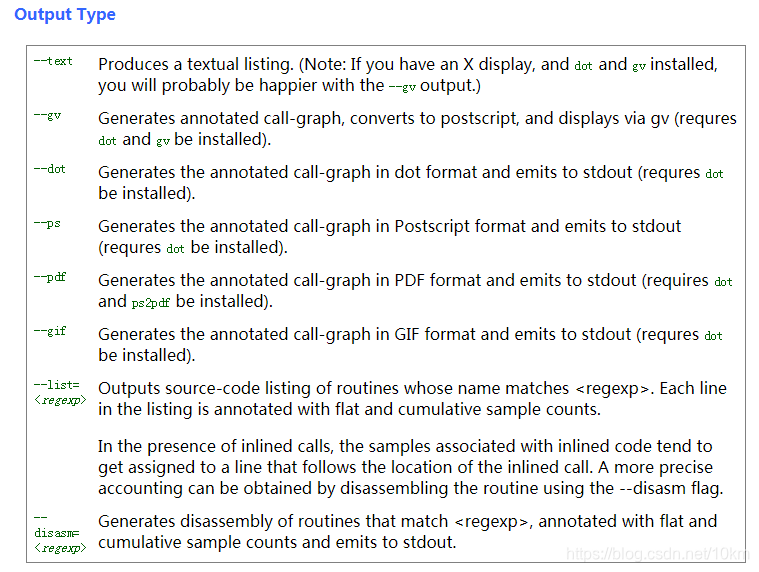
more Output Type
pprof还支持更多输出格式,参见
https://gperftools.github.io/gperftools/cpuprofile.html
执行
pprof --help
也可查看所支持的输出格式
Output type:
   --text              Generate text report
   --stacks            Generate stack traces similar to the heap profiler (requires --text)
   --callgrind         Generate callgrind format to stdout
   --gv                Generate Postscript and display
   --evince            Generate PDF and display
   --web               Generate SVG and display
   --list=<regexp>     Generate source listing of matching routines
   --disasm=<regexp>   Generate disassembly of matching routines
   --symbols           Print demangled symbol names found at given addresses
   --dot               Generate DOT file to stdout
   --ps                Generate Postcript to stdout
   --pdf               Generate PDF to stdout
   --svg               Generate SVG to stdout
   --gif               Generate GIF to stdout
   --raw               Generate symbolized pprof data (useful with remote fetch)
静态连接profiler
有的时候我们需要静态连接
profiler
库(比如在嵌入式系统下做性能分析).根据gperftools的官方说明:
README
,静态连接profiler不能使用
profiler.a
静态库,要用
libtcmalloc_and_profiler.a
替代。
EVERYTHING IN ONE
-----------------
If you want the CPU profiler, heap profiler, and heap leak-checker to
all be available for your application, you can do:
   gcc -o myapp ... -lprofiler -ltcmalloc

However, if you have a reason to use the static versions of the
library, this two-library linking won't work:
   gcc -o myapp ... /usr/lib/libprofiler.a /usr/lib/libtcmalloc.a  # errors!

Instead, use the special libtcmalloc_and_profiler library, which we
make for just this purpose:
   gcc -o myapp ... /usr/lib/libtcmalloc_and_profiler.a
关于采样次数
CPU profiler是基于采样工作的。所以采样次数影响着性能报告的准确性。
如果采样次数过少,则你会发现同样的程序同样的数据,每次输出的性能报告中的热点都不一样。
所以在我的实际应用中,通过循环运行测试程序函数,大幅度提高采样次数。这样才能获得一个稳定的准确的性能报告。
参考资料
https://github.com/gperftools/gperftools/blob/master/README
https://gperftools.github.io/gperftools/cpuprofile.html
https://github.com/gperftools/gperftools/wiki
https://blog.csdn.net/okiwilldoit/article/details/50884670