原因:uni中非web端运行在V8引擎中,不支持web端的window、document、navigator等浏览器的API,只支持标准ES语法。因此借助网上的参考,进行Echarts组件封装,借助renderjs 在视图层操作dom ,进行Echarts实例初始化,并将配置数据定义在主script中的data中,在主script中进行数据的处理。
解决方法:
renderjs
一、xml

二、data数据

三、script导入

四、源码
<template>
<view class=”content”>
<view
:prop=”option”
:change:prop=”echarts.updateEcharts”
id=”echarts”
class=”echarts”
></view>
</view>
</template>
<script>
export default {
data() {
return {
option : {
grid: {
top: ‘0’,
left: ‘0’,
right: ‘0’,
bottom: ‘0’,
},
title: {
text: ”,
subtext: ”,
x: ‘center’
},
legend: {
orient: ‘horizontal’,
icon: “circle”,
textStyle: {
color: ‘rgba(102, 102, 102, 1)’,
padding: [0, 0, 0, -8],
fontSize: 12
},
itemHeight: 6,
left: ‘10%’, //图例距离左的距离
y: ‘90%’, //图例上下居中
data: [“投礁型”,”田园型”,”游钓型”,”底播型”,”装备型”]
},
color: [‘rgba(156, 107, 250, 1)’, ‘rgba(88, 227, 154, 1)’, ‘rgba(248, 202, 93, 1)’,
‘rgba(105, 222, 219, 1)’, ‘rgba(218, 114, 204, 1)’],//五个数据,五个颜色
series: [
{
name: ”,
type: ‘pie’,
radius: [‘40%’, ‘65%’], //图的大小
center: [‘50%’, ‘50%’], //图的位置,距离左跟上的位置
data:[
{
name:”投礁型”,
value:’10’
},
{
name:”田园型”,
value:’8′
},
{
name:”游钓型”,
value:’9′
},
{
name:”底播型”,
value:’5′
},
{
name:”装备型”,
value:’6′
}
]
}
]
},}
}
}
</script>
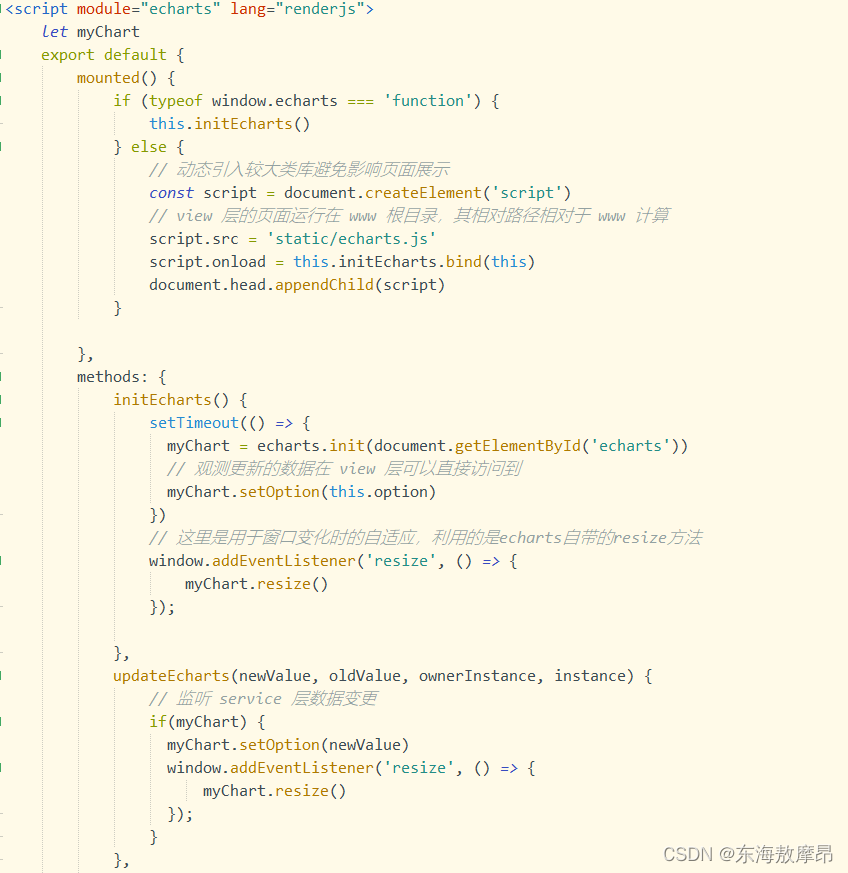
<script module=”echarts” lang=”renderjs”>
let myChart
export default {
mounted() {
if (typeof window.echarts === ‘function’) {
this.initEcharts()
} else {
// 动态引入较大类库避免影响页面展示
const script = document.createElement(‘script’)
// view 层的页面运行在 www 根目录,其相对路径相对于 www 计算
script.src = ‘static/echarts.js’
script.onload = this.initEcharts.bind(this)
document.head.appendChild(script)
}
},
methods: {
initEcharts() {
setTimeout(() => {
myChart = echarts.init(document.getElementById(‘echarts’))
// 观测更新的数据在 view 层可以直接访问到
myChart.setOption(this.option)
})
// 这里是用于窗口变化时的自适应,利用的是echarts自带的resize方法
window.addEventListener(‘resize’, () => {
myChart.resize()
});
},
updateEcharts(newValue, oldValue, ownerInstance, instance) {
// 监听 service 层数据变更
if(myChart) {
myChart.setOption(newValue)
window.addEventListener(‘resize’, () => {
myChart.resize()
});
}
},
onClick(event, ownerInstance) {
// 调用 service 层的方法
ownerInstance.callMethod(‘onViewClick’, {
test: ‘test’
})
}
}
}
</script>
<style>
.echarts {
width: 100%;
height: 434rpx;
}
</style>