人工智能与异常检测
(
Artificial Intelligence and Anomaly Detection
)
Anomaly provides evidence that actual results differ from predicted results based on ML models. We are talking about price prediction and how ML model is behaving compared to actual price data. Here anomaly is defined as a point in time where the behavior of the system is unusual and significantly different from past behavior. So, going by this definition, an anomaly does not necessarily imply a problem. An important use case is the ability to detect anomalies by analyzing and learning the time series. That means AI can be used to detect anomalous data points in the time series by understanding the trends and changes seen from historical data.
一个nomaly提供的证据表明实际结果基于ML模型所预测的结果不同。 我们正在谈论价格预测以及与实际价格数据相比ML模型的行为方式。 在这里,异常被定义为系统行为异常且与过去行为显着不同的时间点。 因此,按照这个定义,异常并不一定意味着有问题。 一个重要的用例是能够通过分析和学习时间序列来检测异常。 这意味着,通过了解历史数据的趋势和变化,可以将AI用于检测时间序列中的异常数据点。
Much of the worlds data is streaming, time-series data, where anomalies give significant information in critical situations. However, detecting anomalies in streaming data is challenging, requiring to process data in real-time, and learn while simultaneously making predictions. The underlying system is often non-stationary, and detectors must continuously learn and adapt to changing statistics while simultaneously making predictions.
世界上许多数据都是按时间顺序排列的流数据,在紧急情况下异常会提供大量信息。 但是,检测流数据中的异常是一项挑战,需要实时处理数据,并在进行预测的同时进行学习。 底层系统通常是不稳定的,检测器必须不断学习并适应变化的统计信息,同时进行预测。
Here we will look at neural network (LSTM) implementations for use cases using time series data as examples. We will develop an anomaly detection model for Time Series data.
在这里,我们将以时间序列数据为例,研究用例的神经网络(LSTM)实现。 我们将为时间序列数据开发异常检测模型。
Let us load Henry Hub Spot Price data from EIA.
让我们从EIA加载Henry Hub现货价格数据。
print("....Data loading...."); print()
print('\033[4mHenry Hub Natural Gas Spot Price, Daily (Dollars per Million Btu)\033[0m')
def retrieve_time_series(api, series_ID):
  series_search = api.data_by_series(series=series_ID)
  spot_price = DataFrame(series_search)
  return spot_pricedef main():
  try:
    api_key = "....API KEY..."
    api = eia.API(api_key)
    series_ID = 'xxxxxx'
    spot_price = retrieve_time_series(api, series_ID)
    print(type(spot_price))
    return spot_price;
  except Exception as e:
    print("error", e)
    return DataFrame(columns=None)
spot_price = main()
spot_price = spot_price.rename({'Henry Hub Natural Gas Spot Price, Daily (Dollars per Million Btu)': 'price'}, axis = 'columns')
spot_price = spot_price.reset_index()
spot_price['index'] = pd.to_datetime(spot_price['index'].str[:-3], format='%Y %m%d')
spot_price['Date']= pd.to_datetime(spot_price['index'])
spot_price.set_index('Date', inplace=True)
spot_price = spot_price.loc['2000-01-01':,['price']]
spot_price = spot_price.astype(float)
print(spot_price)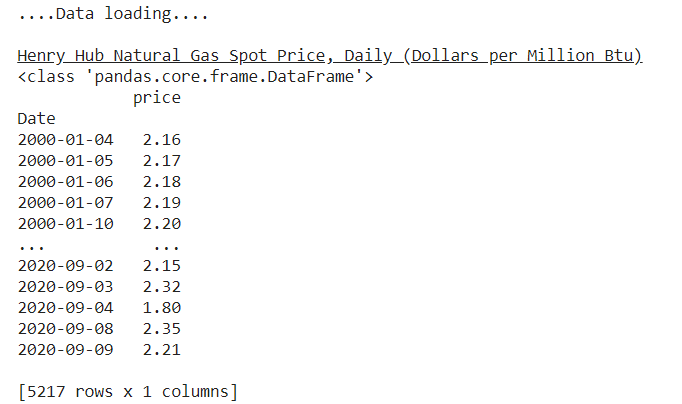
原始数据可视化
(
Raw data visualization
)
print('Historical Spot price visualization:')
plt.figure(figsize = (15,5))
plt.plot(spot_price)
plt.title('Henry Hub Spot Price (Daily frequency)')
plt.xlabel ('Date_time')
plt.ylabel ('Price ($/Mbtu)')
plt.show()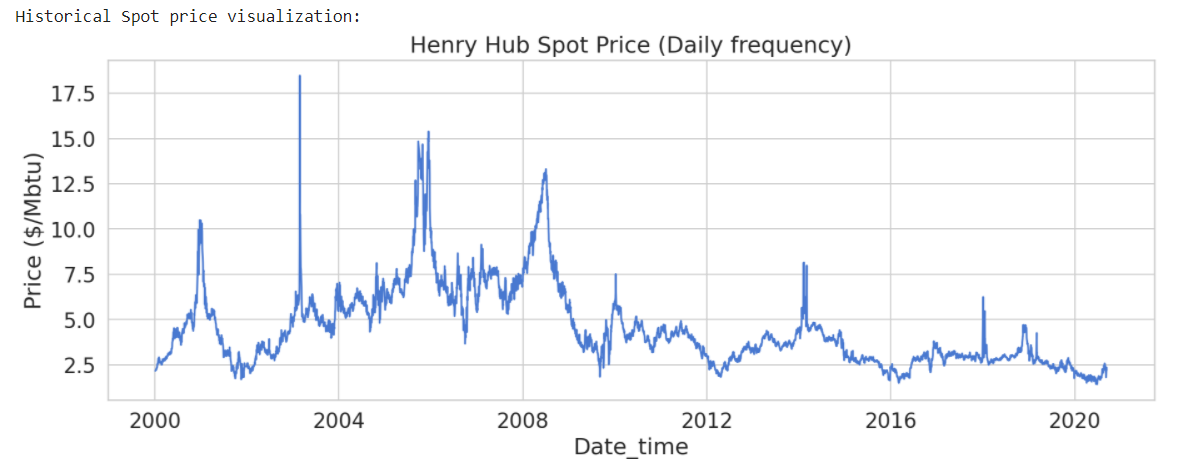
print('Missing values:', spot_price.isnull().sum())
# checking missing values
spot_price = spot_price.dropna()
# dropping missing valies
p