Echarts多图联动的实现

  • Post author:
  • Post category:其他


一、注意点

(1)x轴的类目每个图表要一致

(2)x轴为category类型,y轴为value类型

var option = {
   ......
   xAxis : [
        {
            type : 'category',
            ……………………
        }
    ],
   yAxis : [
        {
            type : 'value',
            ……………………
        }
    ]
   ......
}

二、实例简介

<!DOCTYPE html>
<head>
    <meta charset="utf-8">
    <title>ECharts</title>
</head>
<body>
    <!-- 为ECharts准备一个具备大小(宽高)的Dom -->
    <div id="main1" style="height:200px"></div>
    <div id="main2" style="height:200px"></div>
    <div id="main3" style="height:200px"></div>
    <div id="main4" style="height:200px"></div>
    <!-- ECharts单文件引入 -->
    <script src="http://echarts.baidu.com/build/dist/echarts.js"></script>
    <script type="text/javascript">
        // 路径配置
        require.config({
            paths: {
                echarts: 'http://echarts.baidu.com/build/dist'
            }
        });
        
        // 使用
        require(
            [
                'echarts',
                'echarts/chart/bar', // 使用柱状图就加载bar模块,按需加载
                'echarts/chart/line'
            ],
            function (ec) {
                // 基于准备好的dom,初始化echarts图表
                var myChart1 = ec.init(document.getElementById('main1')); 
                var myChart2 = ec.init(document.getElementById('main2')); 
                var myChart3 = ec.init(document.getElementById('main3')); 
                var myChart4 = ec.init(document.getElementById('main4')); 

                myChart1.setTheme("macarons");
                myChart2.setTheme("macarons");
                myChart3.setTheme("macarons");
                myChart4.setTheme("macarons");
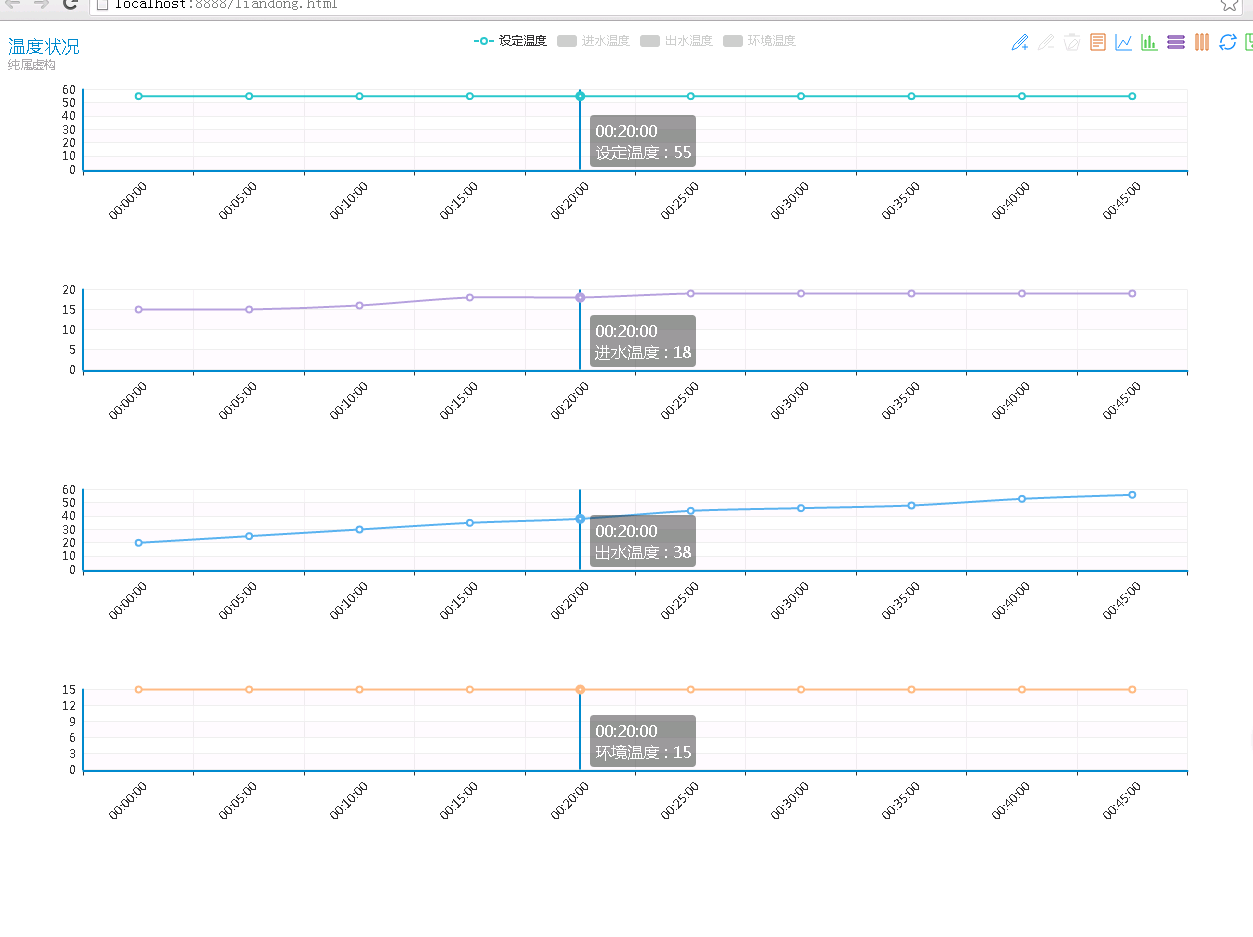
                
                var option1 = {
                    title : {
                        text: '温度状况',
                        subtext: '纯属虚构'
                    },
                    tooltip : {
                        trigger: 'axis'
                    },
                    legend: {
                        data:['设定温度','进水温度','出水温度','环境温度']
                    },
                    toolbox: {
                        show : true,
                        feature : {
                            mark : {show: true},
                            dataView : {show: true, readOnly: false},
                            magicType : {show: true, type: ['line', 'bar', 'stack', 'tiled']},
                            restore : {show: true},
                            saveAsImage : {show: true}
                        }
                    },
                    xAxis : [
                        {
                            type : 'category', //x轴为类目类型
                            axisLabel:{
                                show:true,
                                interval:0,
                                rotate:45
                            },
                            data : ['00:00:00','00:05:00','00:10:00','00:15:00','00:20:00','00:25:00','00:30:00','00:35:00','00:40:00','00:45:00']

                    }],
                    yAxis : [
                        {
                            type : 'value'  //y轴为值类型
                        }
                    ],
                    series : [{  
                        name:'设定温度',
                        type:'line',
                        smooth:true,
                        data:[55,55,55,55,55,55,55,55,55,55]
                    }]
                }

            var option2 = {
                    tooltip : {
                        trigger: 'axis'
                    },
                    legend: {
                        y:-30,
                        data:['设定温度','进水温度','出水温度','环境温度']
                    },
                    toolbox: {
                        y : -30,
                        show : true,
                        feature : {
                            mark : {show: true},
                            dataView : {show: true, readOnly: false},
                            magicType : {show: true, type: ['line', 'bar', 'stack', 'tiled']},
                            restore : {show: true},
                            saveAsImage : {show: true}
                        }
                    },
                    xAxis : [
                        {
                            type : 'category', //x轴为类目类型
                            axisLabel:{
                                show:true,
                                interval:0,
                                rotate:45
                            },
                            data : ['00:00:00','00:05:00','00:10:00','00:15:00','00:20:00','00:25:00','00:30:00','00:35:00','00:40:00','00:45:00']

                    }],
                    yAxis : [
                        {
                            type : 'value'  //y轴为值类型
                        }
                    ],
                    series : [{  
                        name:'进水温度',
                        type:'line',
                        smooth:true,
                        data:[15,15,16,18,18,19,19,19,19,19]
                    }]
                }

            var option3 = {
                    tooltip : {
                        trigger: 'axis'
                    },
                    legend: {
                        y : -30,
                        data:['设定温度','进水温度','出水温度','环境温度']
                    },
                    toolbox: {
                        y : -30,
                        show : true,
                        feature : {
                            mark : {show: true},
                            dataView : {show: true, readOnly: false},
                            magicType : {show: true, type: ['line', 'bar', 'stack', 'tiled']},
                            restore : {show: true},
                            saveAsImage : {show: true}
                        }
                    },
                    xAxis : [
                        {
                            type : 'category', //x轴为类目类型
                            axisLabel:{
                                show:true,
                                interval:0,
                                rotate:45
                            },
                            data : ['00:00:00','00:05:00','00:10:00','00:15:00','00:20:00','00:25:00','00:30:00','00:35:00','00:40:00','00:45:00']

                    }],
                    yAxis : [
                        {
                            type : 'value'  //y轴为值类型
                        }
                    ],
                    series : [{  
                        name:'出水温度',
                        type:'line',
                        smooth:true,
                        data:[20,25,30,35,38,44,46,48,53,56]
                    }]
                }

            var option4 = {
                    tooltip : {
                        trigger: 'axis'
                    },
                    legend: {
                        y : -30,
                        data:['设定温度','进水温度','出水温度','环境温度']
                    },
                    toolbox: {
                        y : -30,
                        show : true,
                        feature : {
                            mark : {show: true},
                            dataView : {show: true, readOnly: false},
                            magicType : {show: true, type: ['line', 'bar', 'stack', 'tiled']},
                            restore : {show: true},
                            saveAsImage : {show: true}
                        }
                    },
                    xAxis : [
                        {
                            type : 'category', //x轴为类目类型
                            axisLabel:{
                                show:true,
                                interval:0,
                                rotate:45
                            },
                            data : ['00:00:00','00:05:00','00:10:00','00:15:00','00:20:00','00:25:00','00:30:00','00:35:00','00:40:00','00:45:00']

                    }],
                    yAxis : [
                        {
                            type : 'value'  //y轴为值类型
                        }
                    ],
                    series : [{  
                        name:'环境温度',
                        type:'line',
                        smooth:true,
                        data:[15,15,15,15,15,15,15,15,15,15]
                    }]
                }

            // 为echarts对象加载数据 
            myChart1.setOption(option1); 
            myChart2.setOption(option2);
            myChart3.setOption(option3);
            myChart4.setOption(option4);
            //联动配置
            myChart1.connect([myChart2, myChart3,myChart4]);
            myChart2.connect([myChart1, myChart3,myChart4]);
            myChart3.connect([myChart2, myChart1,myChart4]);
            myChart4.connect([myChart2, myChart3,myChart1]);

            }
        );
    </script>
</body>


转载于:https://my.oschina.net/mobinchao/blog/524058