项目中 一个页面 tab切换 两张ucharts图表显示隐藏
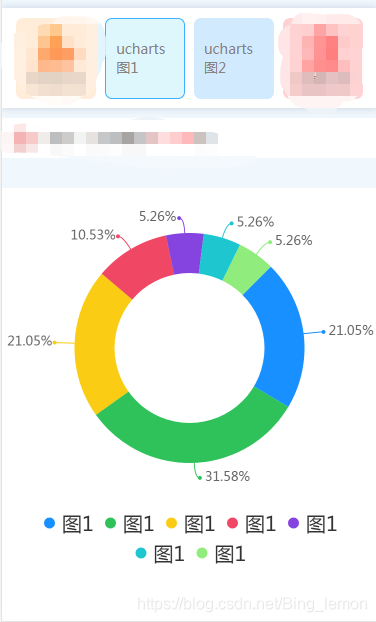
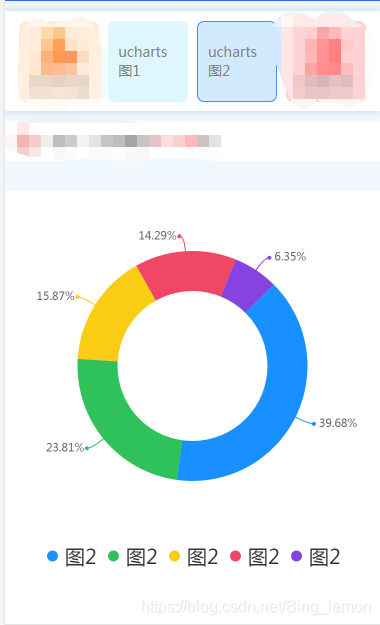
图 1 图2
点击ucharts1 显示图1 点击ucharts2 显示图2
ucharts1 显示 图1 的代码:
template:
// 图1 的canvas-id 是 canvasRing  就是官网down下来的源代码
<view class="qiun-charts">
	<canvas canvas-id="canvasRing" id="canvasRing" class="charts"></canvas>
</view>

// 图2 的canvas-id 是 canvasRings  单词后面加了s  以区分 图1  图2
<view class="qiun-charts">
	<canvas canvas-id="canvasRings" id="canvasRings" class="charts"></canvas>
</view>
js:
// 引用 ucharts 图表
   import uCharts from '@/components/u-charts/u-charts.js';
   var _self;
   var canvaRing = null;     // 图1 canvaRing
   var canvaRings = null;    // 图2 canvaRings
  // 图1  图2 公用的data  写一个就行
    data(){
		return{
		    cWidth: '',
			cHeight: '',
			pixelRatio: 1,
			serverData: '',
		}
	},

    onLoad() {
	    if( 选中ucharts1 ){
			_self = this;
			this.cWidth = uni.upx2px(750);     //  图1 宽度  可修改括号里数值
			this.cHeight = uni.upx2px(800);    //  图1 高度  可修改括号里数值
			// this.getServerData();           //  调接口渲染数据的方法
			this.showRing('canvasRing');       //  加载 图1 canvasRing
  		}else if( 选中ucharts2 ){
			_self = this;
			this.cWidth = uni.upx2px(750);   // 同上
			this.cHeight = uni.upx2px(800);
			// this.getServerData();
			this.showRings('canvasRings')    // 图2 的是 canvasRings
		}
	    },

        methods:{
         // 选 ucharts1 的方法
         checkb:function(){
			_self = this;
			this.cWidth = uni.upx2px(750);
			this.cHeight = uni.upx2px(800);
			// this.getServerData();
			this.showRing('canvasRing');    // 切换tab的时候 要点两下图表才出现 所以加了个定时器
			setTimeout(() =>{
				this.showRing('canvasRing');
			},300)
			},

        // 选 ucharts2 的方法   同上
		checkc:function(){
			_self = this;
			this.cWidth = uni.upx2px(750);
			this.cHeight = uni.upx2px(800);
			// this.getServerData();
			this.showRings('canvasRings');
			setTimeout(() =>{
				this.showRings('canvasRings');
			},300)
			},

        // 图1 的数据
			showRing(canvasId) {
				var chartData = {
					series :[{
						"name": "图1",
						"data": 20
					  }, {
						"name": "图1",
						"data": 30
					  }, {
						"name": "图1",
						"data": 20
					  }, {
						"name": "图1",
						"data": 10
					  }, {
						"name": "图1",
						"data": 5
					  }, {
						"name": "图1",
						"data": 5
					  }, {
						"name": "图1",
						"data": 5
					  }]
				};
				canvaRing = new uCharts({
					$this: _self,
					canvasId: canvasId,
					type: 'ring',
					fontSize: 13,
					legend: {   // 这个是 图例的相关配置参数  其他的参数见官网
						show:true,
						fontSize:20,
						lineHeight:30,
						float:'center',
						position:'bottom'
					},
					extra: {
						pie: {
							offsetAngle: -45,
							ringWidth: 40 * _self.pixelRatio,
							labelWidth: 15
						}
					},
					background: '#fff',
					pixelRatio: _self.pixelRatio,
					series: chartData.series,  // 渲染上面的数据
					animation: false,
					width: _self.cWidth * _self.pixelRatio,
					height: _self.cHeight * _self.pixelRatio,
					disablePieStroke: true,
					dataLabel: true,
				});
			},


            // 图2 的数据  注:图2的 有s  如:showRings、chartDatas  区别 图1 和图2
			showRings(canvasId) {
				var chartDatas = {
					series: [{
						"name": "图2",
						"data": 50
					}, {
						"name": "图2",
						"data": 30
					}, {
						"name": "图2",
						"data": 20
					}, {
						"name": "图2",
						"data": 18
					}, {
						"name": "图2",
						"data": 8
					}]
				};
				canvaRings = new uCharts({
					$this: _self,
					canvasId: canvasId,
					type: 'ring',
					fontSize: 11,
					legend: {
						show:true,
						fontSize:20,
						lineHeight:30,
						float:'center',
						position:'bottom'
					},
					extra: {
						pie: {
							offsetAngle: -45,
							ringWidth: 40 * _self.pixelRatio,
							labelWidth: 15
						}
					},
					background: '#fff',
					pixelRatio: _self.pixelRatio,
					series: chartDatas.series,
					animation: false,
					width: _self.cWidth * _self.pixelRatio,
					height: _self.cHeight * _self.pixelRatio,
					disablePieStroke: true,
					dataLabel: true,
				});
			},
        }
再强调一遍!! 图1 是官网源码 没有s 图 2 是为了区分 加了s 不区分会有冲突 某个图表不显示或者都不显示或者出现其他的问题。
版权声明:本文为weixin_51102356原创文章,遵循 CC 4.0 BY-SA 版权协议,转载请附上原文出处链接和本声明。