mongodb数据可视化
Using Python to connect to Taiwan Government PM2.5 open data API, and schedule to update data in real time to MongoDB — Part 2
使用Python连接到台湾政府PM2.5开放数据API,并计划将数据实时更新到MongoDB —第2部分
目标
(
Goal
)
This time I’m using the same PM2.5 open data API (used in
Part 1
) to showcase how to refresh real time data into mongoDB for every 2 min (because it’s the time for the government’s portal to refresh its API). The strength of mongoDB is it’s simple to use, especially with JSON document format data. This makes connecting to open data much easier. Also we can directly show real time data changes from our database using its Charts & Dashboard features.
这次,我使用相同的PM2.5开放数据API(在
第1部分中
使用过)来展示如何每2分钟将实时数据刷新到mongoDB中(因为这是政府门户网站刷新其API的时间)。 mongoDB的优势在于它易于使用,尤其是使用JSON文档格式数据时。 这使得连接打开的数据变得更加容易。 我们还可以使用其“图表和仪表板”功能直接从数据库中显示实时数据更改。
How convenient!
多么方便!
The below demo uses Taipei City (the capital city of Taiwan) as example:
下面的演示以台北市(台湾省会城市)为例:
Skills covered:
涵盖技能:
-
Connect to API with required parameters to filter out all sensors data in Taipei City
连接到具有所需参数的API,以过滤掉台北市中的所有传感器数据
-
Insert the first batch of data into mongoDB
将第一批数据插入mongoDB
-
Set a schedule to extract new batch of PM2.5 data from API into mongoDB
设置时间表以从API将新的PM2.5数据批次提取到mongoDB中
-
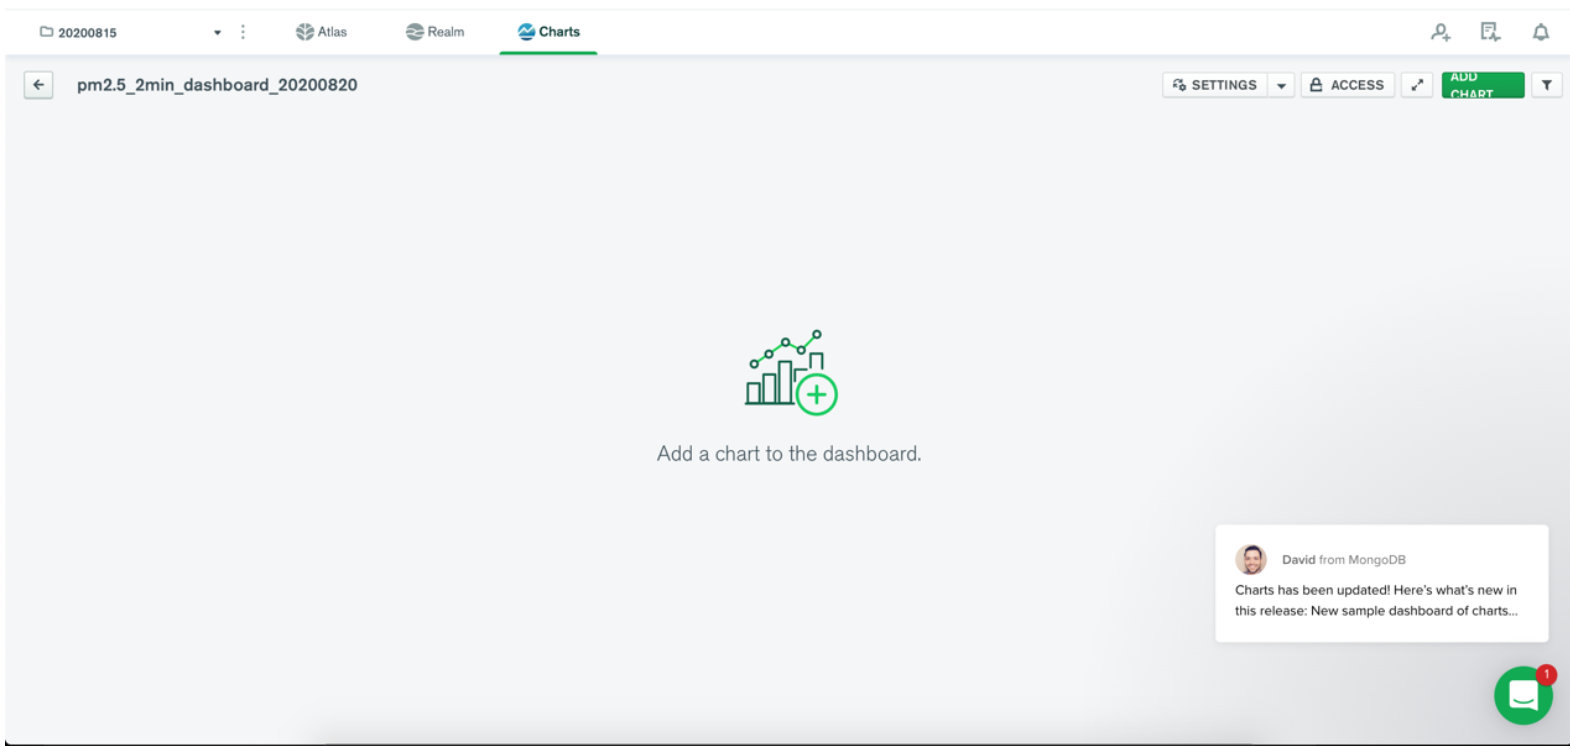
Create charts into dashboard
将图表创建到仪表板
So, let’s get started.
因此,让我们开始吧。
处理
(
Process
)
Import all required libraries:
导入所有必需的库:
# connect to mongoDB cloud cluster
import pymongo
from pymongo import MongoClient
# convert timezone
import pytz, dateutil.parser
# connect to government open data API
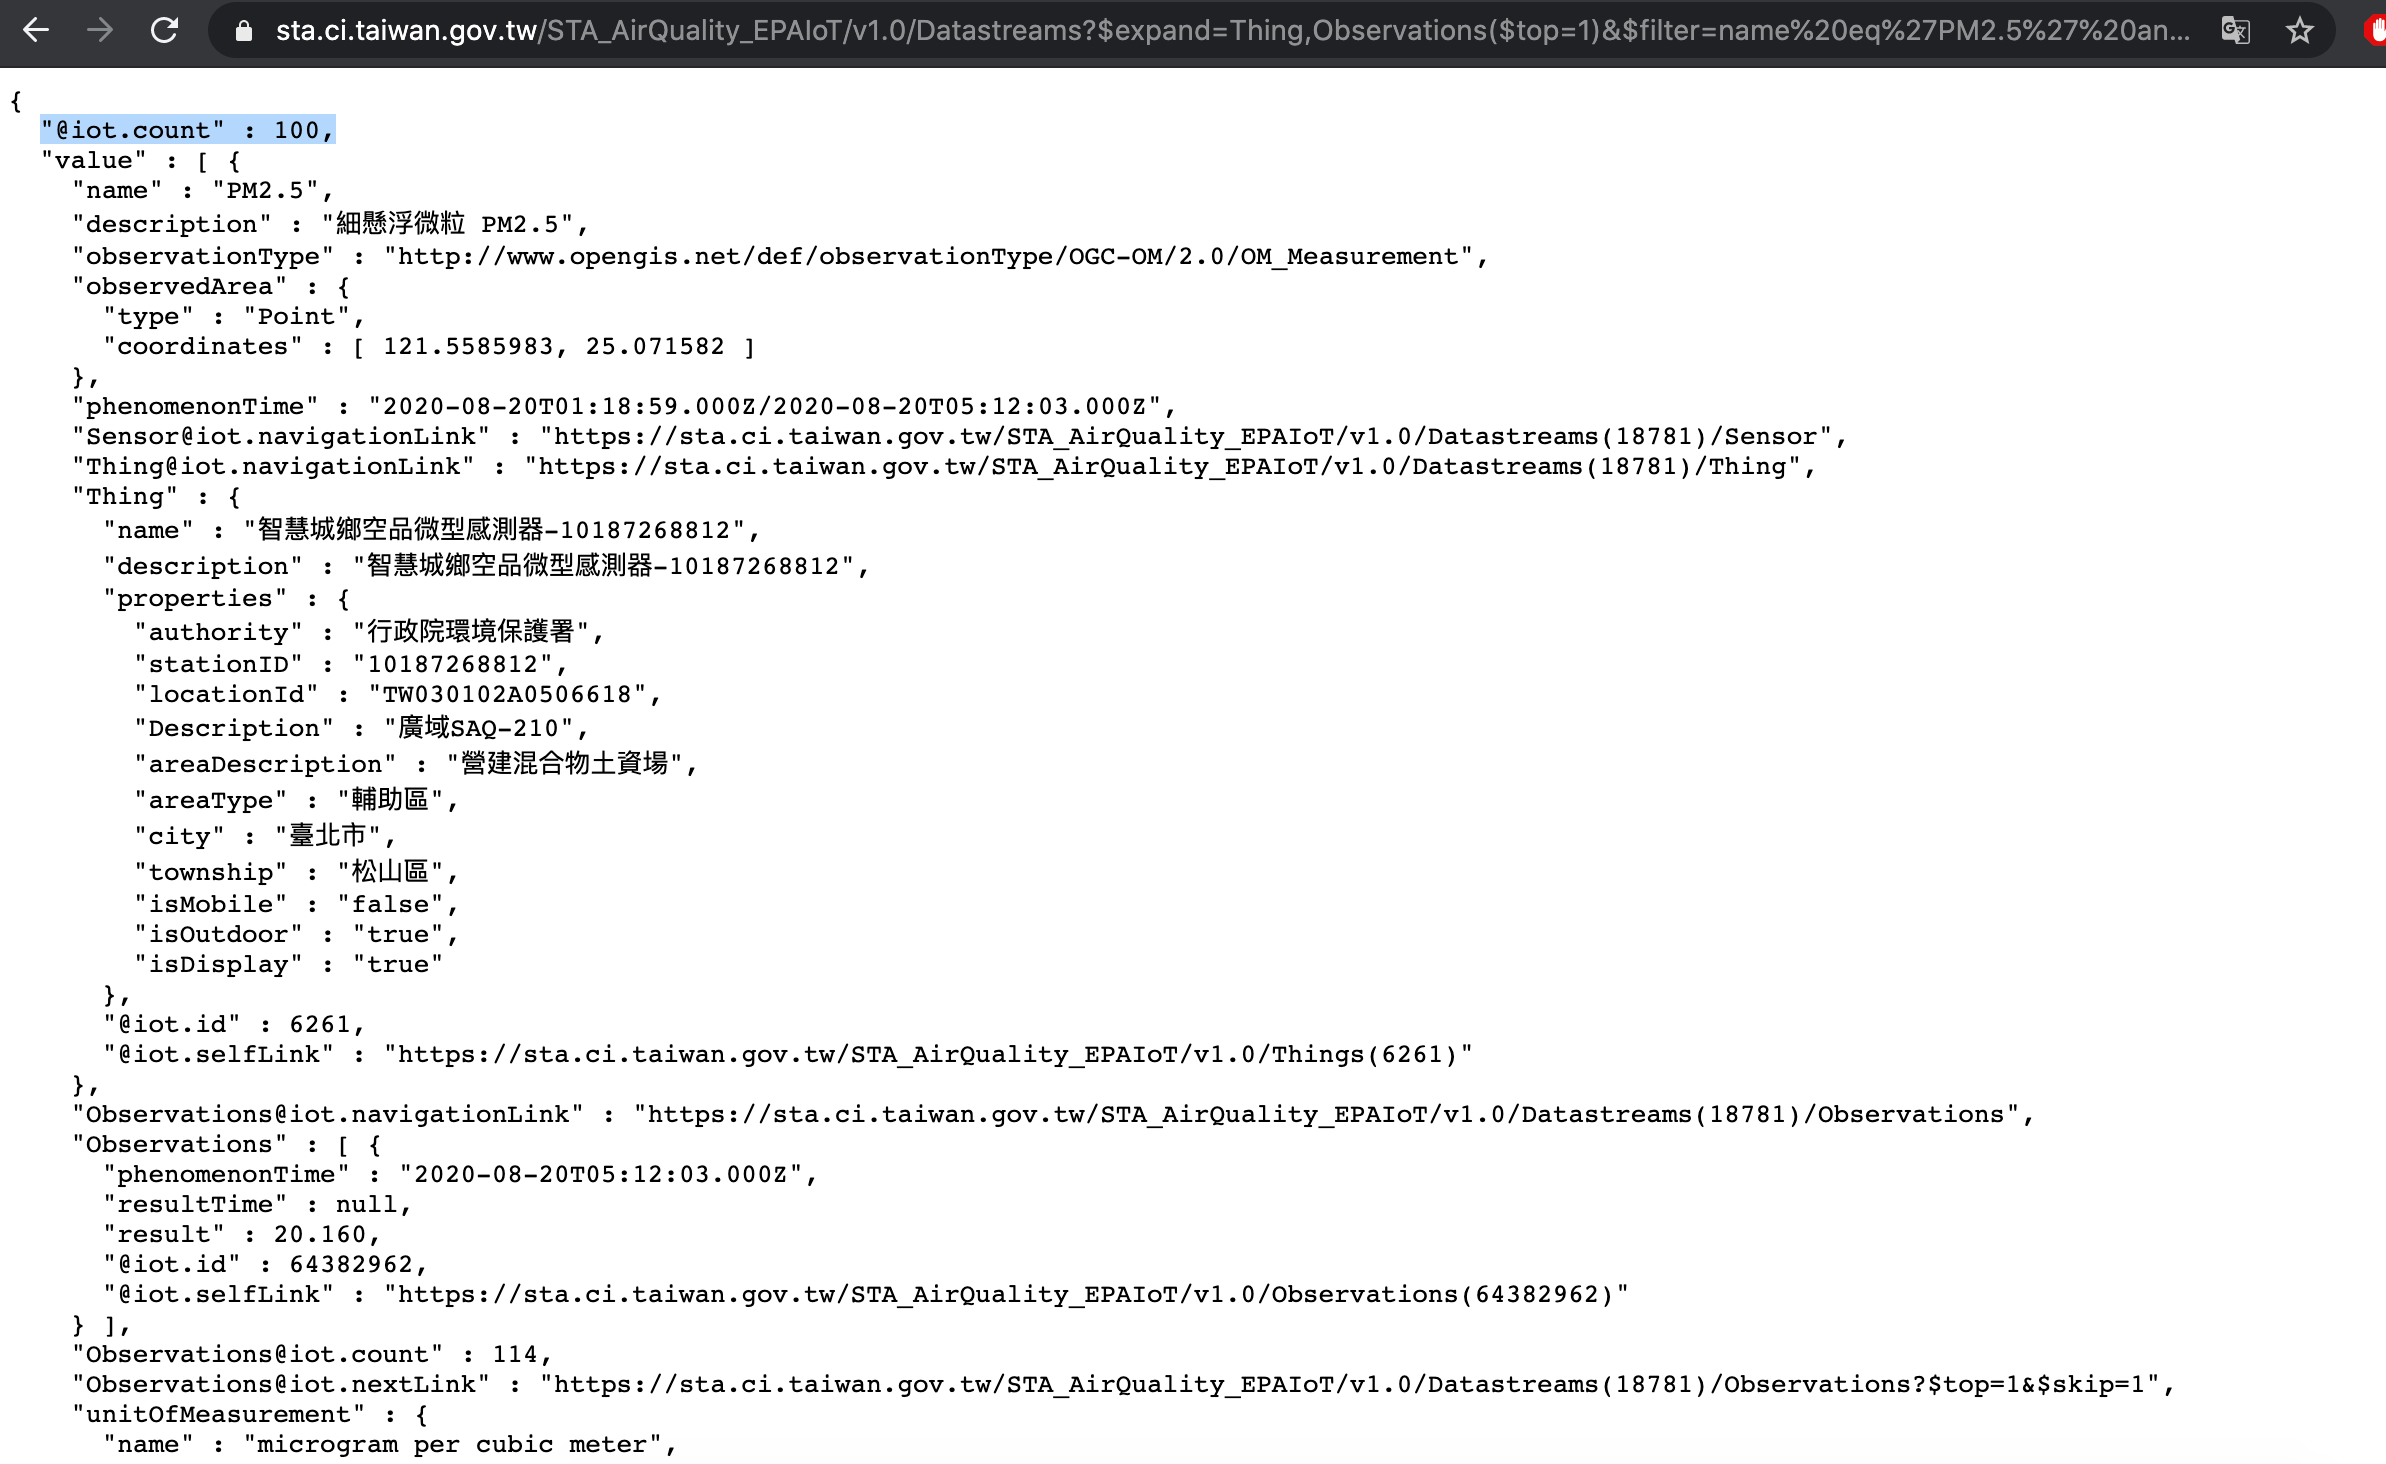
import requestsConnect to API with required parameters to filter out all sensors data in Taipei City. Raw data looks like below (total count of sensors is 100):
使用必需的参数连接到API,以过滤掉台北市中的所有传感器数据。 原始数据如下所示(传感器总数为100):
All data was stored in “first_batch” variable:
所有数据都存储在“ first_batch”变量中:
# Parameters: the latest data, observation value > 0, PM2.5 data only, Taipei city
# https://sta.ci.taiwan.gov.tw/STA_AirQuality_EPAIoT/v1.0/Datastreams?$expand=Thing,Observations($top=1)&$filter=name eq'PM2.5' and Observations/result gt 0 and Thing/properties/city eq '臺北市'&$count=true


def API_data():
    API_URL = "https://sta.ci.taiwan.gov.tw/STA_AirQuality_EPAIoT/v1.0/Datastreams?$expand=Thing,Observations($top=1)&$filter=name%20eq%27PM2.5%27%20and%20Observations/result%20gt%200%20and%20Thing/properties/city%20eq%20%27%E8%87%BA%E5%8C%97%E5%B8%82%27&$count=true"
    total = requests.get(API_URL).json()
    data = total['value']
    first_batch = []
    for item in data:
        dic = {}
        dic['_id'] = item['Thing']['properties']['stationID']
        dic['name'] = item['name']
        dic['areaDescription'] = item['Thing']['properties']['areaDescription']
        dic['city'] = item['Thing']['properties']['city']
        dic['township'] = item['Thing']['properties']['township']
        dic['observedArea'] = item['observedArea']
        dic['iso8601_UTC_0'] = item['Observations'][0]['phenomenonTime']
        UTC_0 = dateutil.parser.parse(dic['iso8601_UTC_0'])
        dic['UTC_0'] = str(UTC_0)
        UTC_8 = UTC_0.astimezone(pytz.timezone("Asia/Taipei"))
        dic['UTC_8'] = str(UTC_8)
        dic['result'] = item['Observations'][0]['result']
        dic['unitOfMeasurement'] = item['unitOfMeasurement']['symbol']
        first_batch.append(dic)
    return first_batch


first_batch = API_data()
The first value within “first_batch” list is a sensor station’s data read:
“ first_batch”列表中的第一个值是读取的传感器站数据:
print(first_batch[0])# output:
{'_id': '10189360662', 'name': 'PM2.5', 'areaDescription': '營建混合物土資場', 'city': '臺北市', 'township': '北投區', 'observedArea': {'type': 'Point', 'coordinates': [121.4871916, 25.121195]}, 'iso8601_UTC_0': '2020-08-20T05:22:58.000Z', 'UTC_0': '2020-08-20 05:22:58+00:00', 'UTC_8': '2020-08-20 13:22:58+08:00', 'result': 22.0, 'unitOfMeasurement': 'μg/m3'}
Then connect to my mongoDB Atlas and insert the first batch of data:
然后连接到我的mongoDB Atlas并插入第一批数据:
# connect to my mongoDB cloud cluster


cluster = MongoClient("mongodb+srv://<username>:<password>@cluster0.dd7sd.mongodb.net/<dbname>?retryWrites=true&w=majority")


# my database name
db = cluster["test"]


# my collection's name
collection = db["test2"]


results = collection.insert_many(first_batch)
Next, set a scheduler to pull out latest PM2.5 data read from API (every 2 min and stop at a time whenever we wanted) and update data by “_id” on mongoDB i.e. “stationID” of each station:
接下来,设置一个调度程序以提取从API读取的最新PM2.5数据(每2分钟一次,并在需要时停止一次),并在mongoDB上通过“ _id”更新数据,即每个站的“ stationID”:
import schedule
import time
import datetime
import sys
def update_content():
# get a new batch
new_batch = API_data()
for item in new_batch:
update_data = {"iso8601_UTC_0": item['iso8601_UTC_0'], "UTC_0": item['UTC_0'], "UTC_8": item['UTC_8'], "result": item['result']}
results = collection.update_one({"_id": item['_id']}, {"$set": update_data}, upsert=True)
def stop_update():
sys.exit()
schedule.every(2).minutes.do(update_content)
schedule.every(5).minutes.do(stop_update)
while True:
schedule.run_pending()
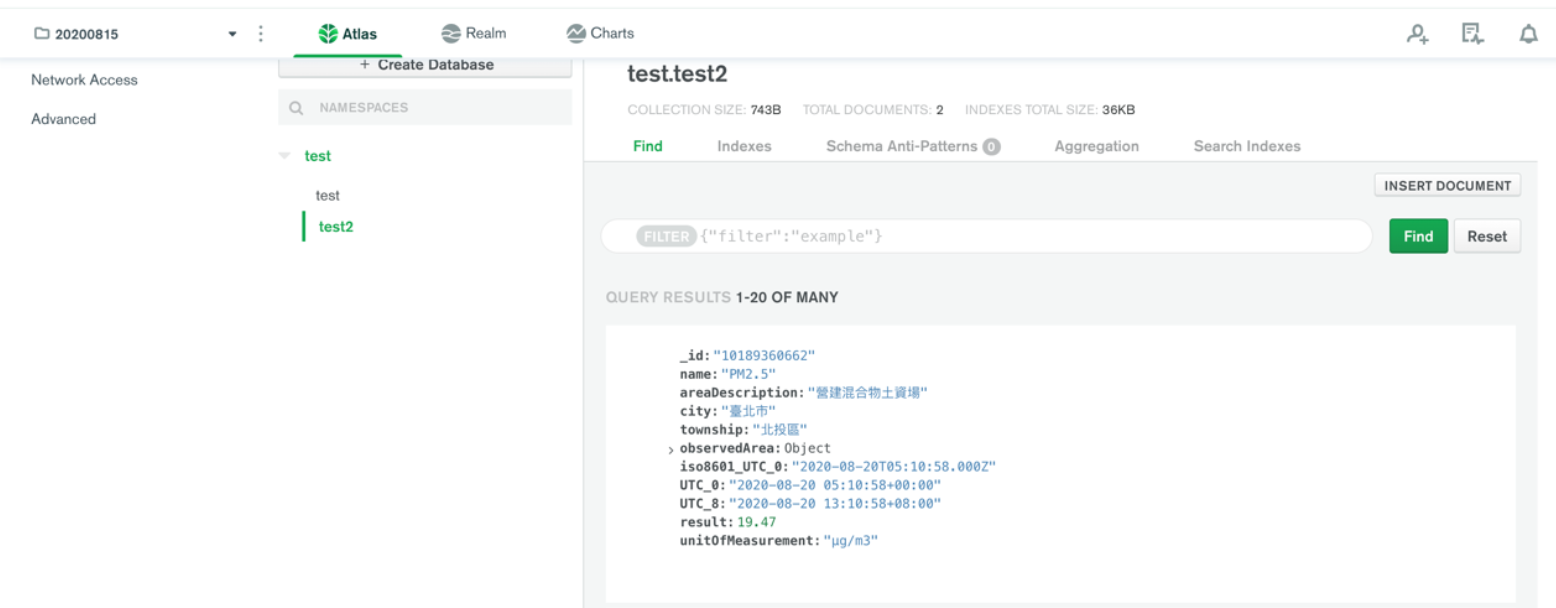
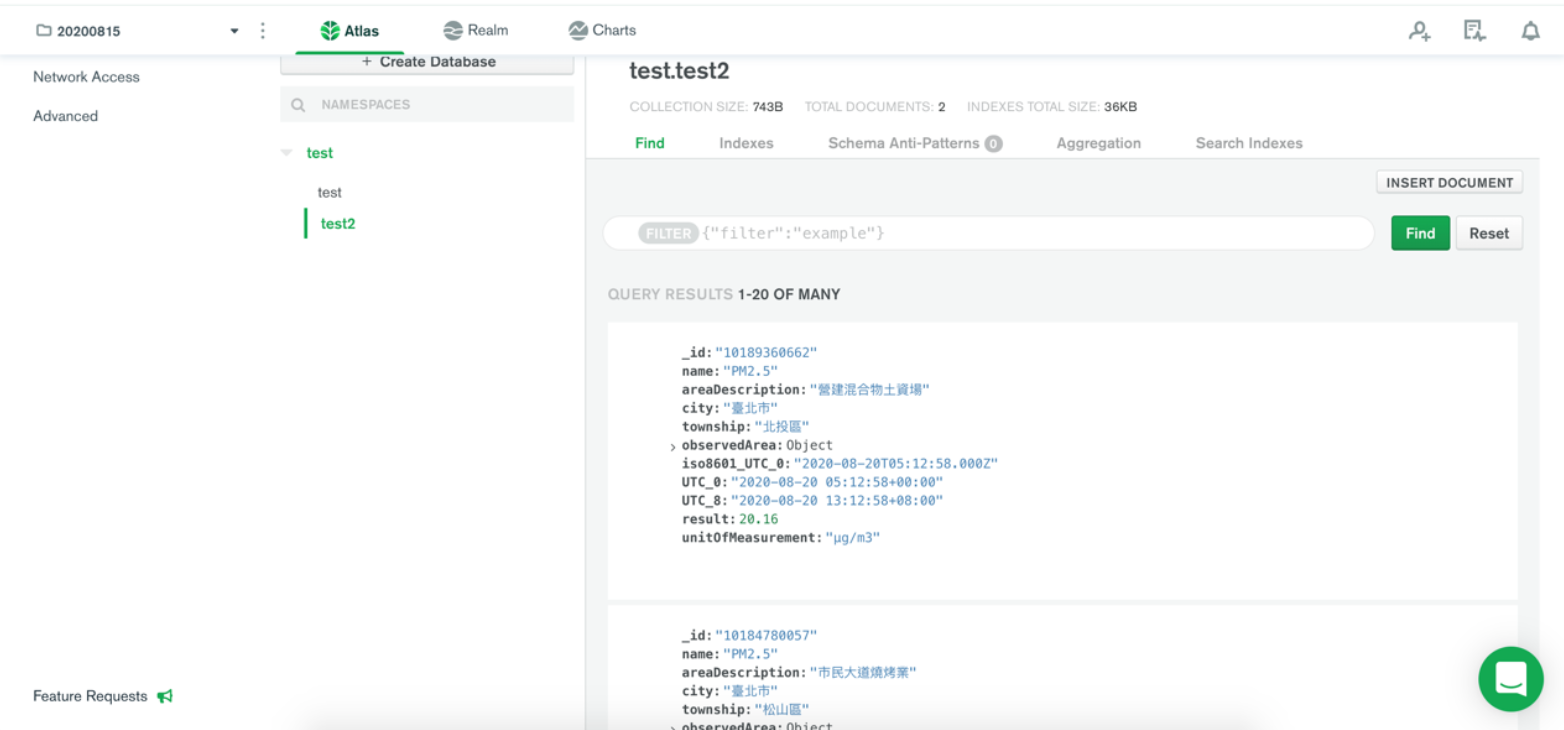
time.sleep(1)In mongoDB it will look like this:
在mongoDB中,它将如下所示:
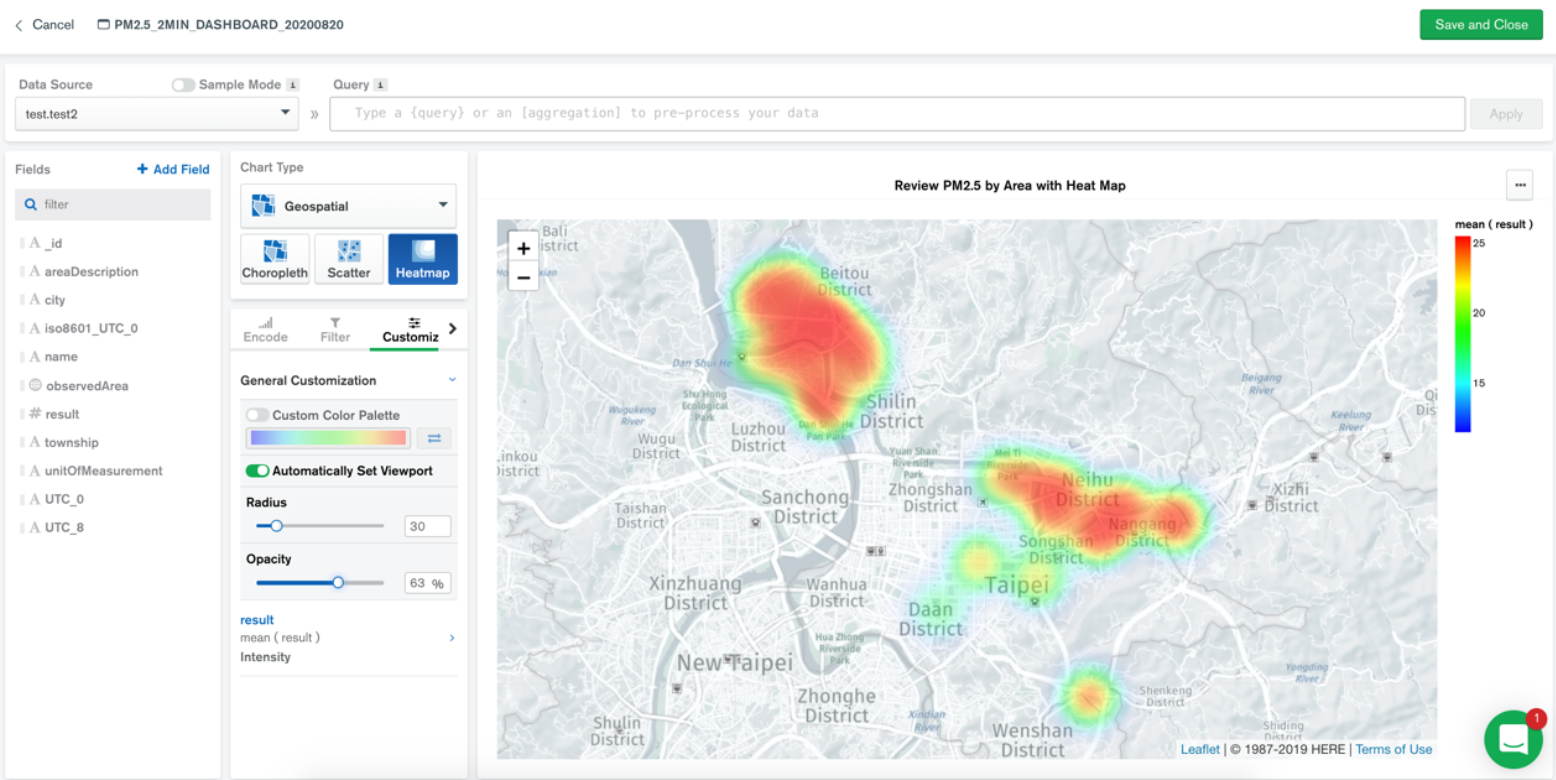
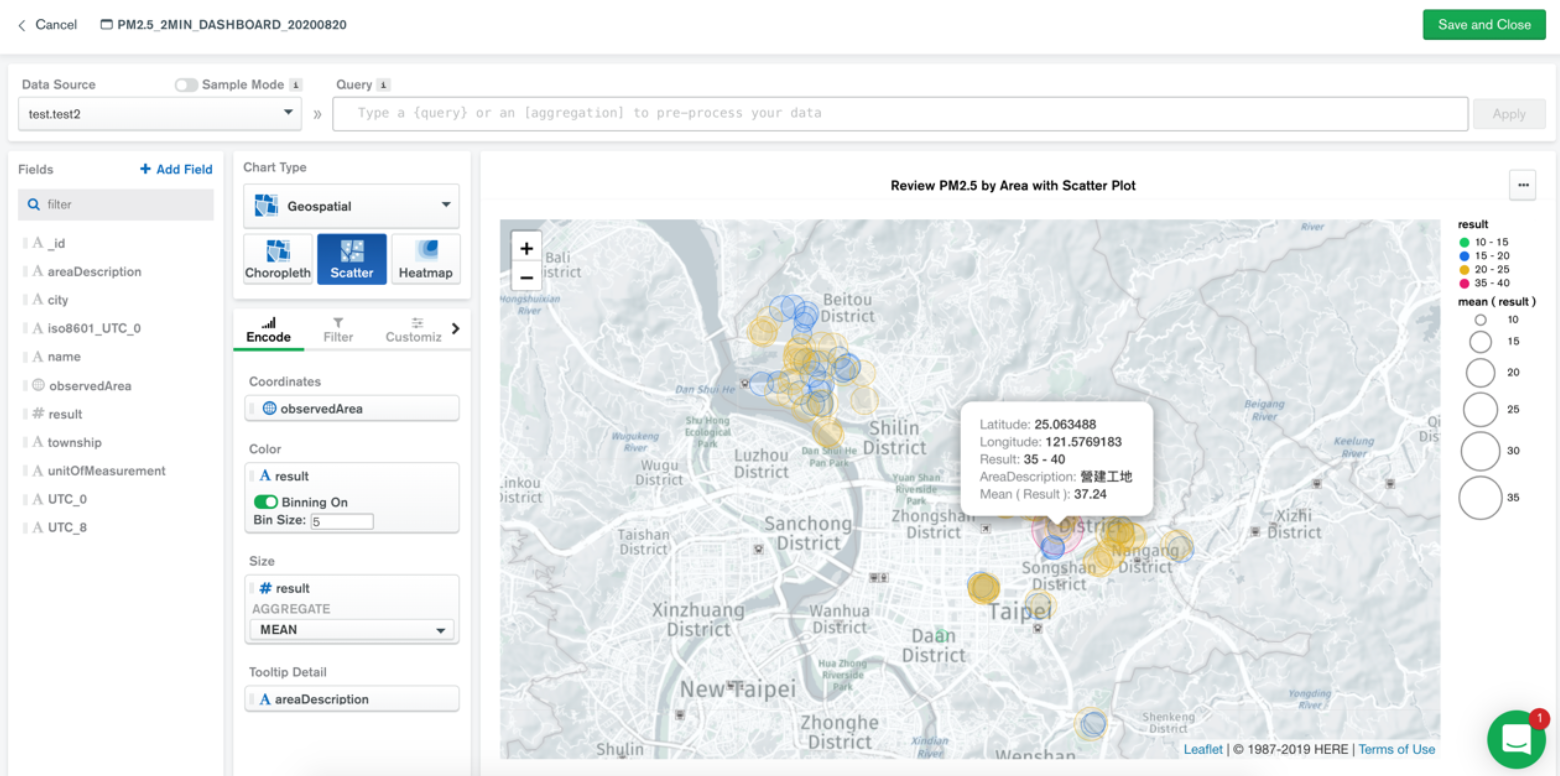
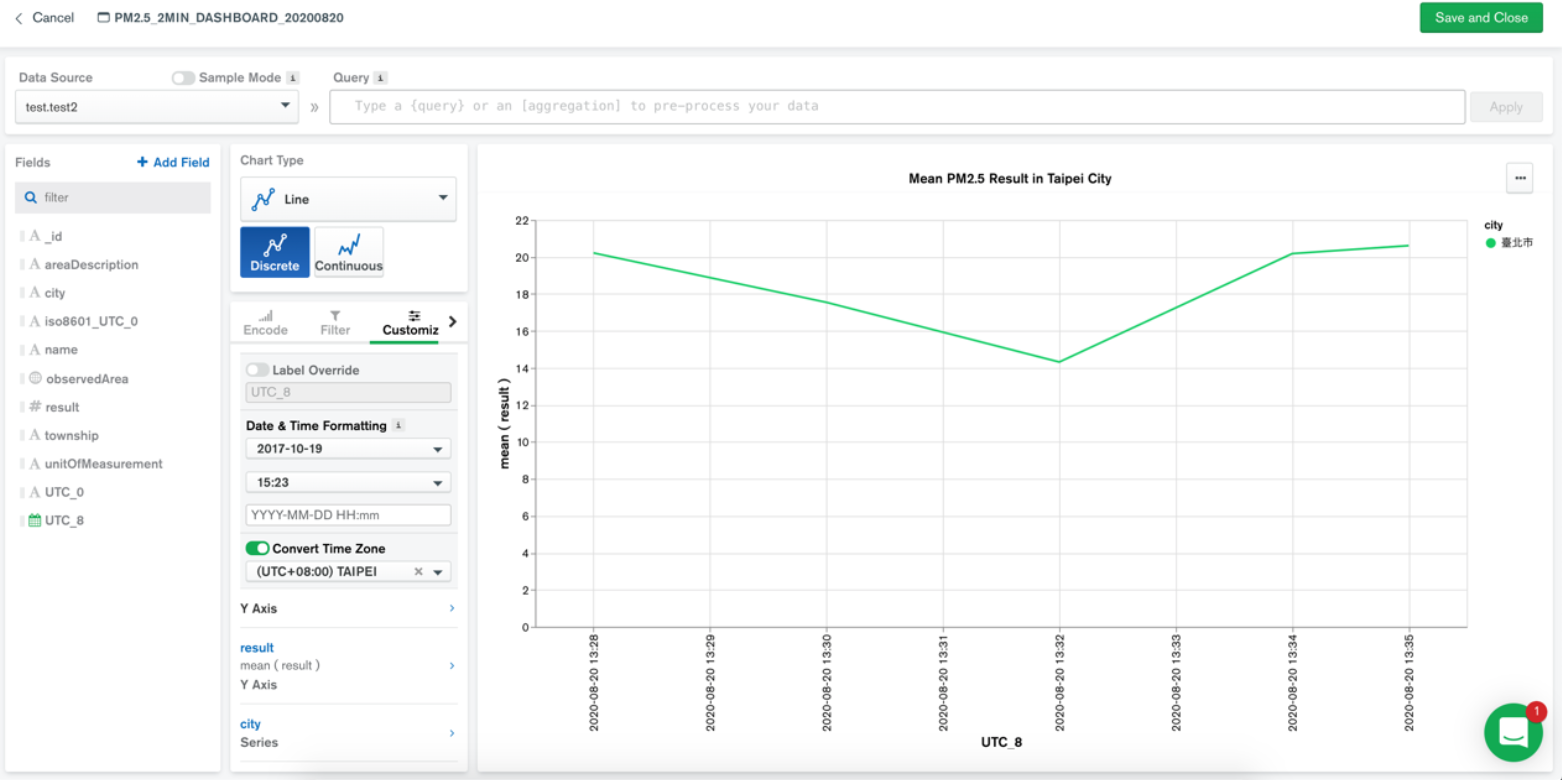
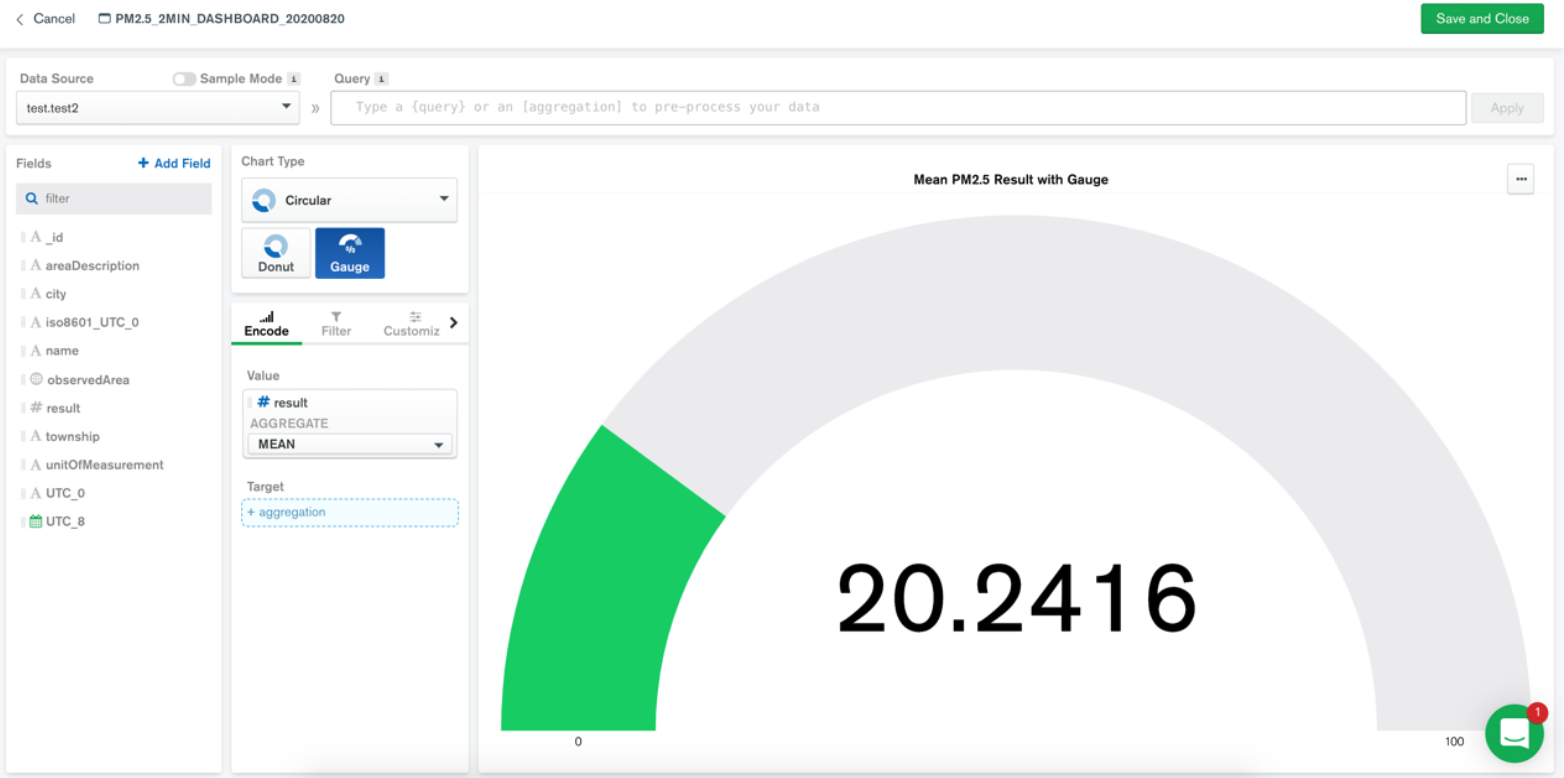
Lastly, we created each charts on dashboard as following:
最后,我们在仪表板上创建了每个图表,如下所示:
结论
(
Conclusion
)
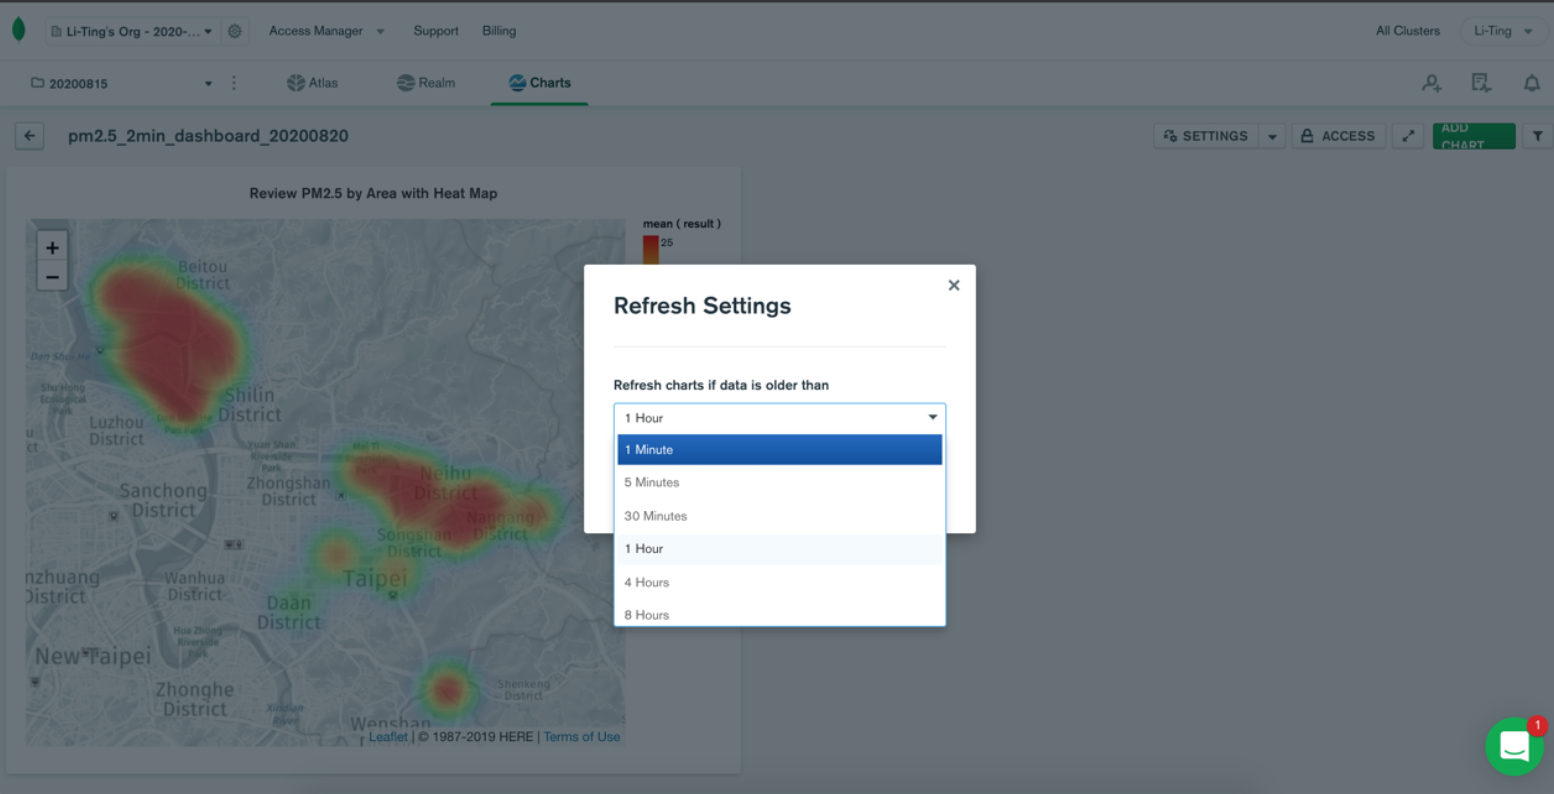
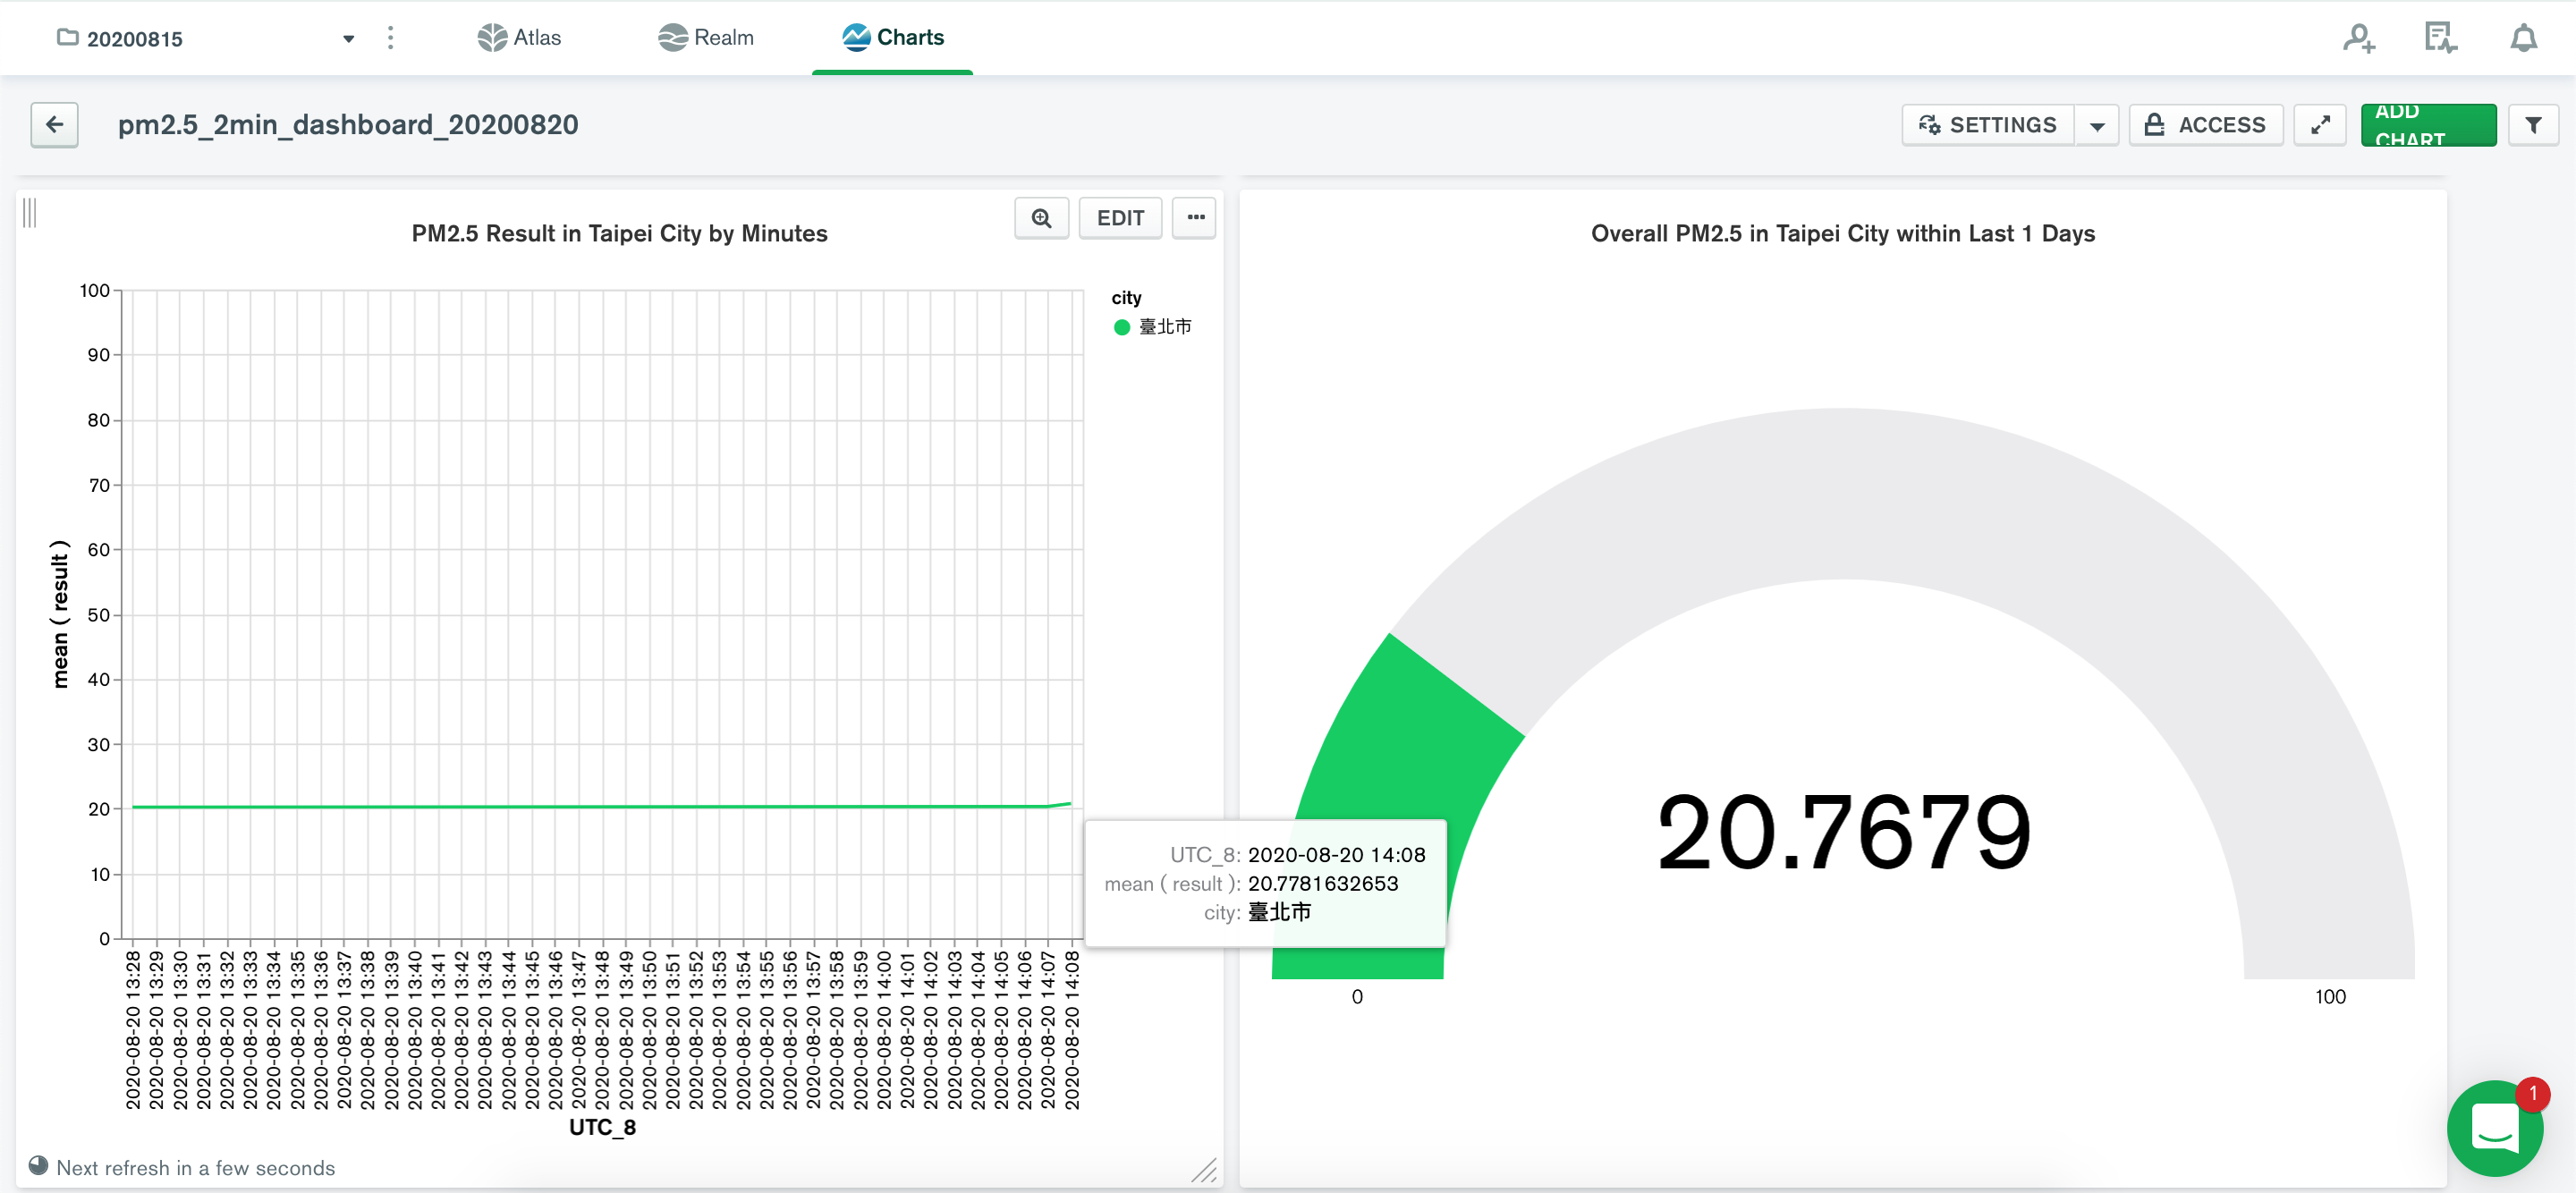
With the above 4 charts, our dashboard is ready:
有了以上4个图表,我们的仪表板已准备就绪:
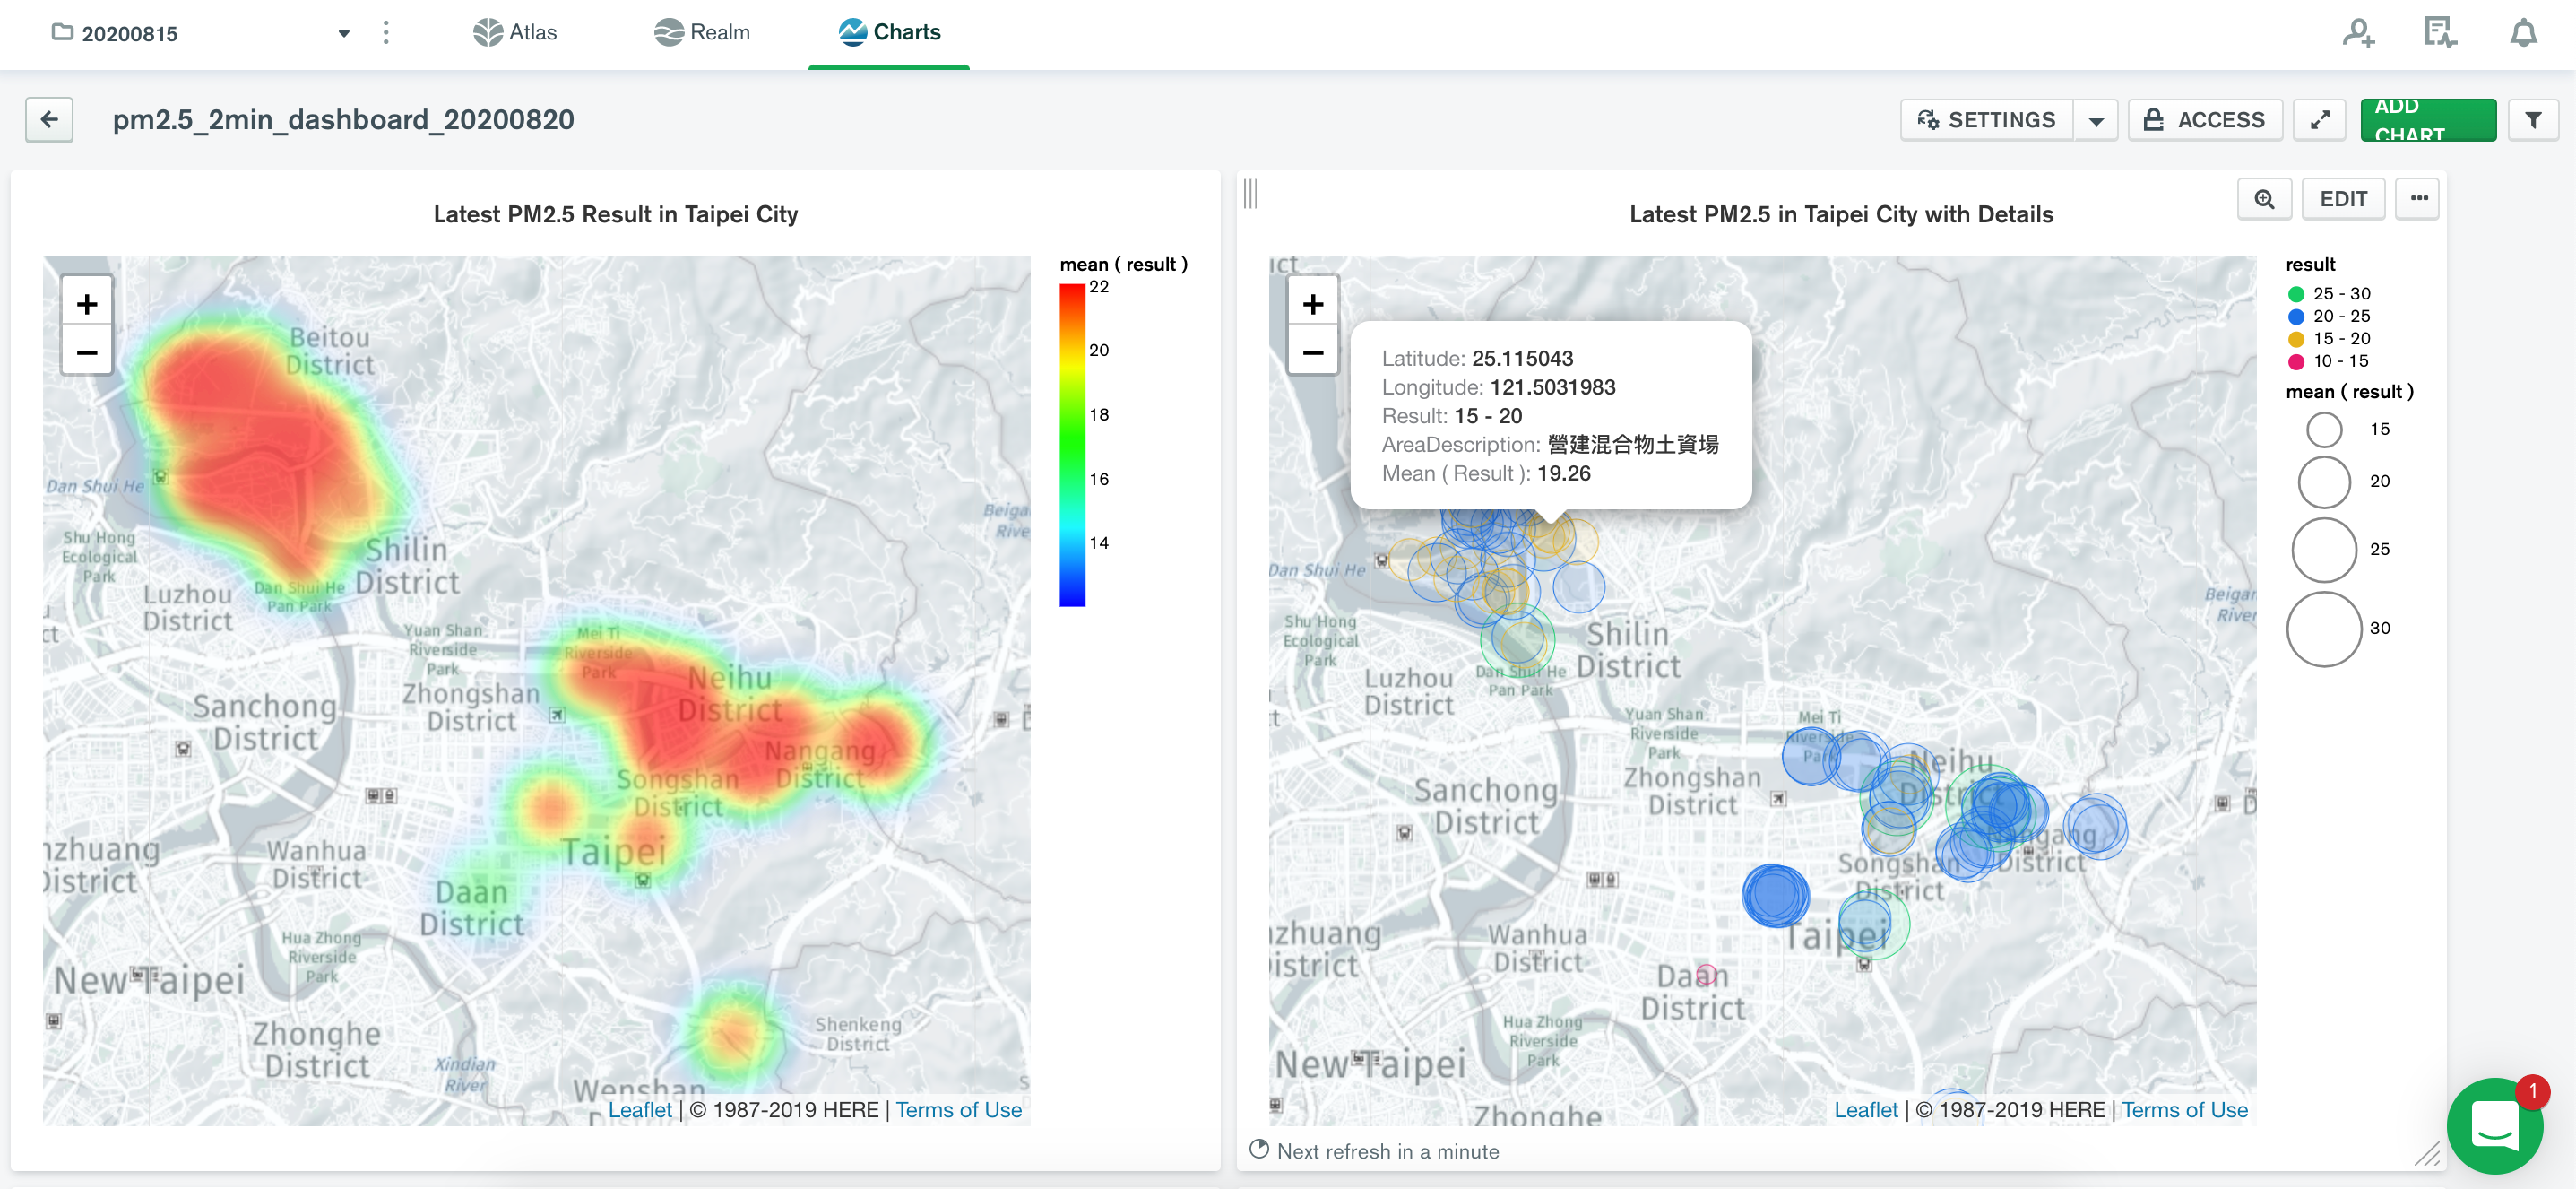
We can further modify the color according to the intensity level set by government e.g. in Taiwan, 0–30 μg/m3 is low, 30–50 μg/m3 is medium, etc. Below I set within 5 min, how much the PM2.5 intensity changed “slightly” across different sensors in Taipei City on both maps. This clip was recorded later than the previous demo, around 19:00–19:30, but still on the same day.
我们可以根据政府设定的强度水平进一步修改颜色,例如在台湾,0–30μg/ m3低,30–50μg/ m3中度等。在5分钟内低于我设定的PM2。在两张地图上,台北市的不同传感器上的5个强度“略有变化”。 该剪辑的录制时间比上一个演示晚,大约在19:00–19:30,但仍在同一天。
At the left-bottom corner of scatter plot, it shows how much time left for mongoDB to refresh the data input again, or just stare at the below clip for 10 sec you may spot the difference 😀
在散点图的左下角,它显示了mongoDB再次刷新数据输入还有多少时间,或者只是盯着下面的剪辑10秒钟,您可能会发现差异:D
That’s it. Hope you find this helpful.
而已。 希望对您有所帮助。
Have a wonderful day!
祝你有美好的一天!
翻译自:
https://medium.com/li-ting-liao-tiffany/visualize-open-data-using-mongodb-in-real-time-2cca4bcca26e
mongodb数据可视化