测试pod的时候promethus的记录学习
服务器集群如下:
10.37.0.101 node1
10.37.0.103 node2
10.37.0.216 master
一、服务端配置
先通过kubectl启promethus及其配置,这里看两个配置就行一个是9090端口用来收集数据,另外一个是host,是进行host配置以便用于通过prometheus.devops.com直接访问,
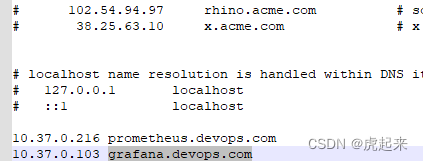
可以在windows的system32/drives/hosts或者linux下的/etc/hosts文件添加你的普罗米修斯服务器hosts映射即可,如下:
10.37.0.216 prometheus.devops.com
cat promethus.yaml

#promethus.yaml
apiVersion: v1
kind: Namespace
metadata:
  name: monitor
---
apiVersion: apps/v1
kind: Deployment
metadata:
  name: prometheus
  namespace: monitor
  labels:
    app: prometheus
spec:
  selector:
    matchLabels:
      app: prometheus
  template:
    metadata:
      labels:
        app: prometheus
    spec:
      serviceAccountName: prometheus
      nodeSelector:
        prometheus: "true"
      initContainers:
      - name: "change-permission-of-directory"
        image: busybox
        command: ["/bin/sh"]
        args: ["-c", "chown -R 65534:65534 /prometheus"]
        securityContext:
          privileged: true
        volumeMounts:
        - mountPath: "/etc/prometheus"
          name: config-volume
        - mountPath: "/prometheus"
          name: data
      containers:
      - image: prom/prometheus:v2.28.0
        name: prometheus
        args:
        - "--config.file=/etc/prometheus/prometheus.yml"
        - "--storage.tsdb.path=/prometheus"  # 指定tsdb数据路径
        - "--web.enable-lifecycle"  # 支持热更新,直接执行localhost:9090/-/reload立即生效
        - "--web.console.libraries=/usr/share/prometheus/console_libraries"
        - "--web.console.templates=/usr/share/prometheus/consoles"
        ports:
        - containerPort: 9090
          name: http
        volumeMounts:
        - mountPath: "/etc/prometheus"
          name: config-volume
        - mountPath: "/prometheus"
          name: data
        resources:
          requests:
            cpu: 100m
            memory: 512Mi
          limits:
            cpu: 100m
            memory: 512Mi
      volumes:
      - name: data
        hostPath:
          path: /data/prometheus/
      - configMap:
          name: prometheus-config
        name: config-volume
---
apiVersion: v1
kind: ServiceAccount
metadata:
  name: prometheus
  namespace: monitor
---
apiVersion: rbac.authorization.k8s.io/v1
kind: ClusterRole
metadata:
  name: prometheus
rules:
- apiGroups:
  - ""
  resources:
  - nodes
  - services
  - endpoints
  - pods
  - nodes/proxy
  verbs:
  - get
  - list
  - watch
- apiGroups:
  - "extensions"
  resources:
    - ingresses
  verbs:
  - get
  - list
  - watch
- apiGroups:
  - ""
  resources:
  - configmaps
  - nodes/metrics
  verbs:
  - get
- nonResourceURLs:
  - /metrics
  verbs:
  - get
---
apiVersion: rbac.authorization.k8s.io/v1
kind: ClusterRoleBinding
metadata:
  name: prometheus
roleRef:
  apiGroup: rbac.authorization.k8s.io
  kind: ClusterRole
  name: prometheus
subjects:
- kind: ServiceAccount
  name: prometheus
  namespace: monitor
---
apiVersion: v1
kind: Service
metadata:
  name: prometheus
  namespace: monitor
  labels:
    app: prometheus
spec:
  selector:
    app: prometheus
  type: ClusterIP
  ports:
    - name: web
      port: 9090
      targetPort: http
---
apiVersion: networking.k8s.io/v1
kind: Ingress
metadata:
  name: prometheus
  namespace: monitor
spec:
  rules:
  - host: prometheus.devops.com
    http:
      paths:
      - path: /
        pathType: Exact
        backend:
          service:
            name: prometheus
            port:
              number: 9090
---
然后启动收集数据的配置Prometheus-configmap.yaml,采集的node的数据ip及端口配置一下即可
#Prometheus-configmap.yaml
apiVersion: v1
kind: ConfigMap
metadata:
name: prometheus-config
namespace: monitor
data:
prometheus.yml: |
global:
scrape_interval: 15s
evaluation_interval: 15s
scrape_configs:
- job_name: 'prometheus'
static_configs:
- targets: ['10.37.0.216:9090']
- job_name: 'k8s-master'
static_configs:
- targets: ['10.37.0.216:9100']
- job_name: 'k8s-slave2'
static_configs:
- targets: ['10.37.0.103:9100']
- job_name: 'k8s-slave1'
static_configs:
- targets: ['10.37.0.101:9100']
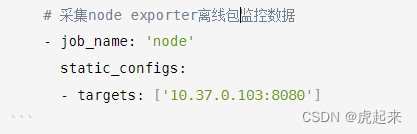
# 采集node exporter离线包监控数据
- job_name: 'node'
static_configs:
- targets: ['10.37.0.103:8080']
配置收集接受数据的node-exporter.yaml
#node-exporter.yaml
apiVersion: apps/v1
kind: DaemonSet
metadata:
  name: node-exporter
  namespace: monitor
  labels:
    name: node-exporter
spec:
  selector:
    matchLabels:
      name: node-exporter
  template:
    metadata:
      labels:
        name: node-exporter
    spec:
      hostPID: true
      hostIPC: true
      hostNetwork: true
      containers:
      - name: node-exporter
        image: prom/node-exporter:v1.0.1
        ports:
        - containerPort: 9100
        resources:
          requests:
            cpu: 0.15
        securityContext:
          privileged: true
        args:
        - --path.procfs
        - /host/proc
        - --path.sysfs
        - /host/sys
        - --collector.filesystem.ignored-mount-points
        - '"^/(sys|proc|dev|host|etc)($|/)"'
        volumeMounts:
        - name: dev
          mountPath: /host/dev
        - name: proc
          mountPath: /host/proc
        - name: sys
          mountPath: /host/sys
        - name: rootfs
          mountPath: /rootfs
      tolerations:
      - key: "node-role.kubernetes.io/master"
        operator: "Exists"
        effect: "NoSchedule"
      volumes:
        - name: proc
          hostPath:
            path: /proc
        - name: dev
          hostPath:
            path: /dev
        - name: sys
          hostPath:
            path: /sys
        - name: rootfs
          hostPath:
            path: /
分别kubectl create -f这三yaml文件
kubectl create -f promethus.yaml
kubectl create -f Prometheus-configmap.yaml
kubectl create -f node-exporter.yaml
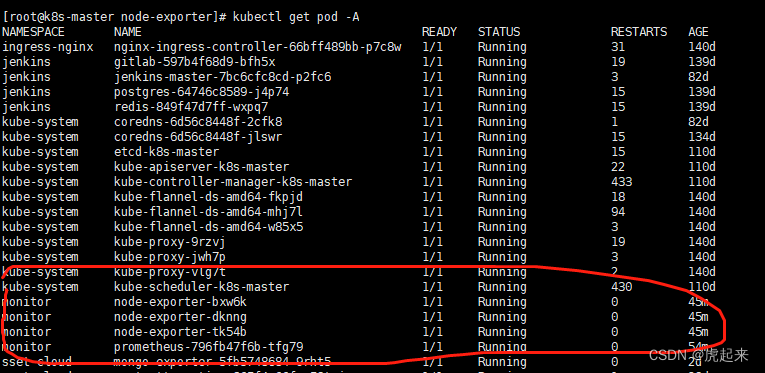
通过kubectl get pod -A观察启动无误
二,客户端配置
直接kubectl create -f promethus上述的node-export即可。
顺便这里加了一个离线包的node_export以供需要离线安装node_export时也能正常使用,下载地址
https://download.csdn.net/download/xinshuzhan/12281198?utm_source=iteye_new
随意下载一个node_export,通过tar -xvf 解压下载的tar.gz包
配置自启动
cp node_exporter-0.18.1.linux-amd64/node_exporter /usr/local/bin/
[root@localhost opt]# vim /usr/lib/systemd/system/node_exporter.service
[Unit]
Description=node_export
Documentation=https://github.com/prometheus/node_exporter
After=network.target

[Service]
Type=simple
User=prometheus
ExecStart=/usr/local/bin/node_exporter
Restart=on-failure
[Install]
WantedBy=multi-user.target
启用离线包监听及服务
./node_exporter –web.listen-address 10.37.0.103:8080
curl 10.37.0.103:8080
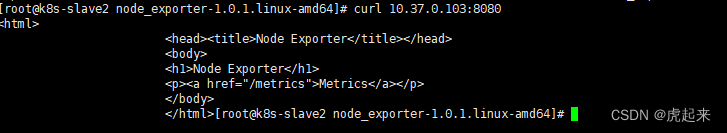
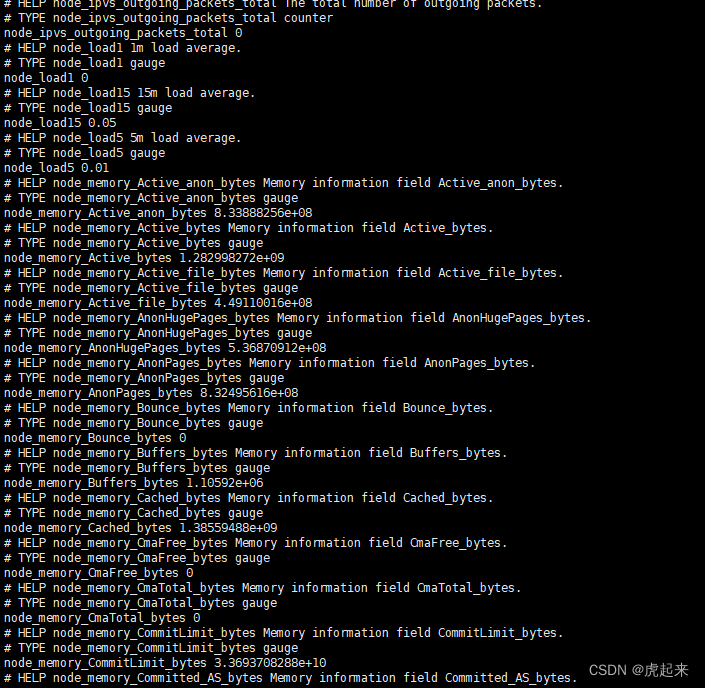
通过html可以看到下面有一个curl 10.37.0.103:8080/metrics,就可以得到我们想要的上报数据了,同时也确认了自己的数据export成功
启动
[root@localhost opt]# systemctl daemon-reload
[root@localhost opt]# systemctl enable node_exporter
Created symlink from /etc/systemd/system/multi-user.target.wants/node_exporter.service to /usr/lib/systemd/system/node_exporter.service.
[root@localhost opt]# systemctl start node_exporter
查看验证下是否正常处于监听
[root@localhost opt]# netstat -anlptu|grep 9100

在上述的node_export.yaml加上,上面已经加过了
三,访问promethus自带的ui去进行验证
上面进行host配置过了
所以直接访问prometheus.devops.com即可
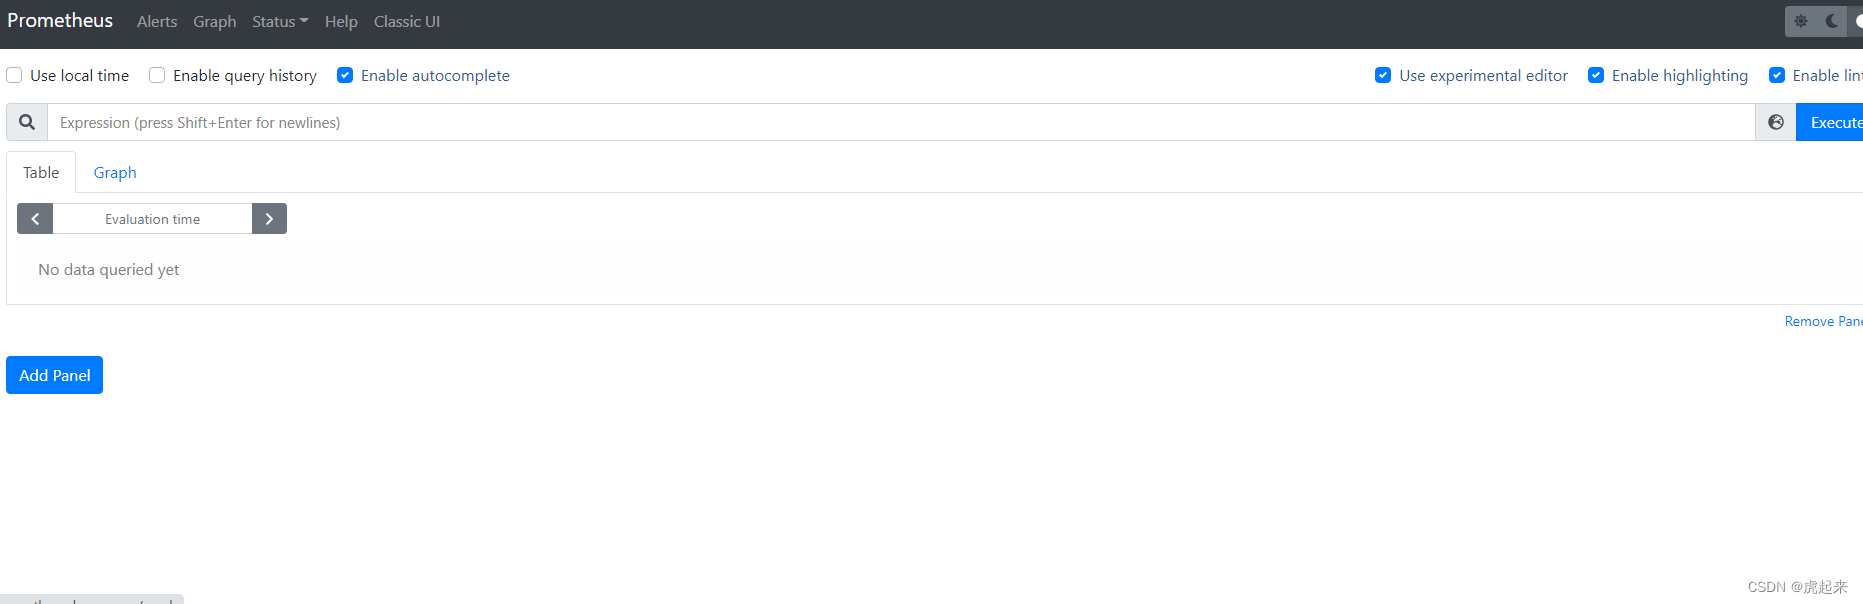
这里可以看到已经正常启动promethus了,验证看一下是否正常监控,通过excute输入查看cpu
100 – (avg by (instance) (irate(node_cpu_seconds_total{mode=“idle”}[5m])) * 100)
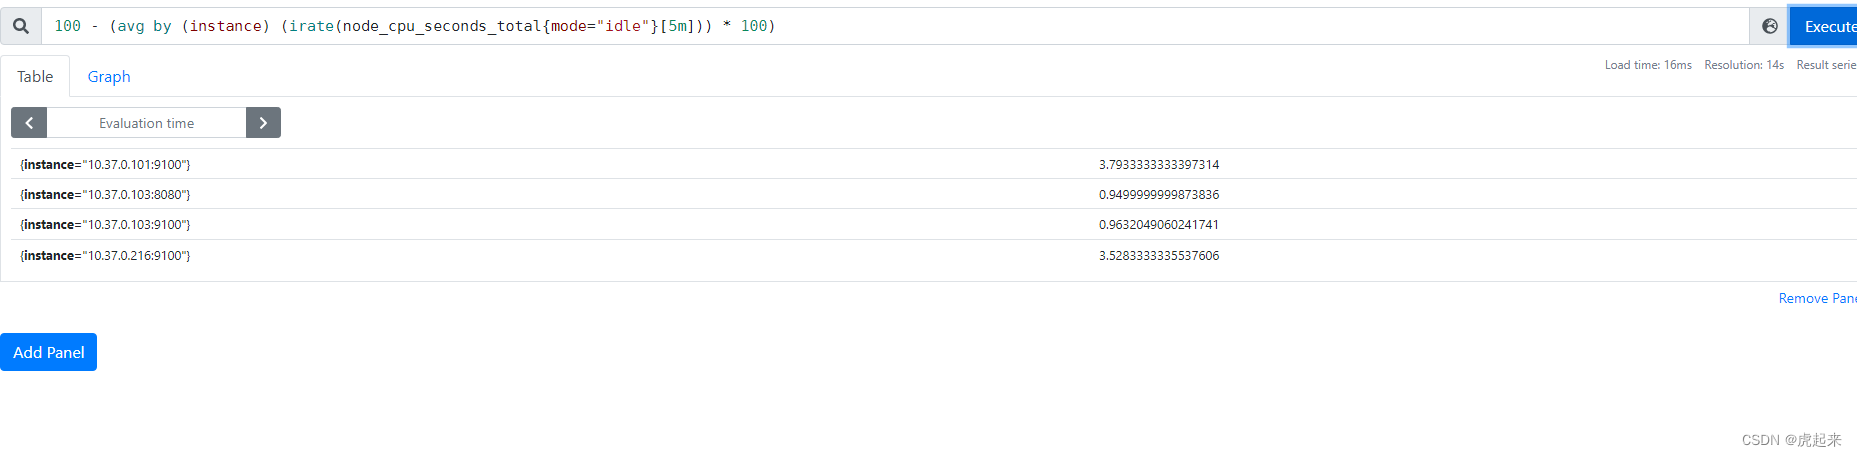
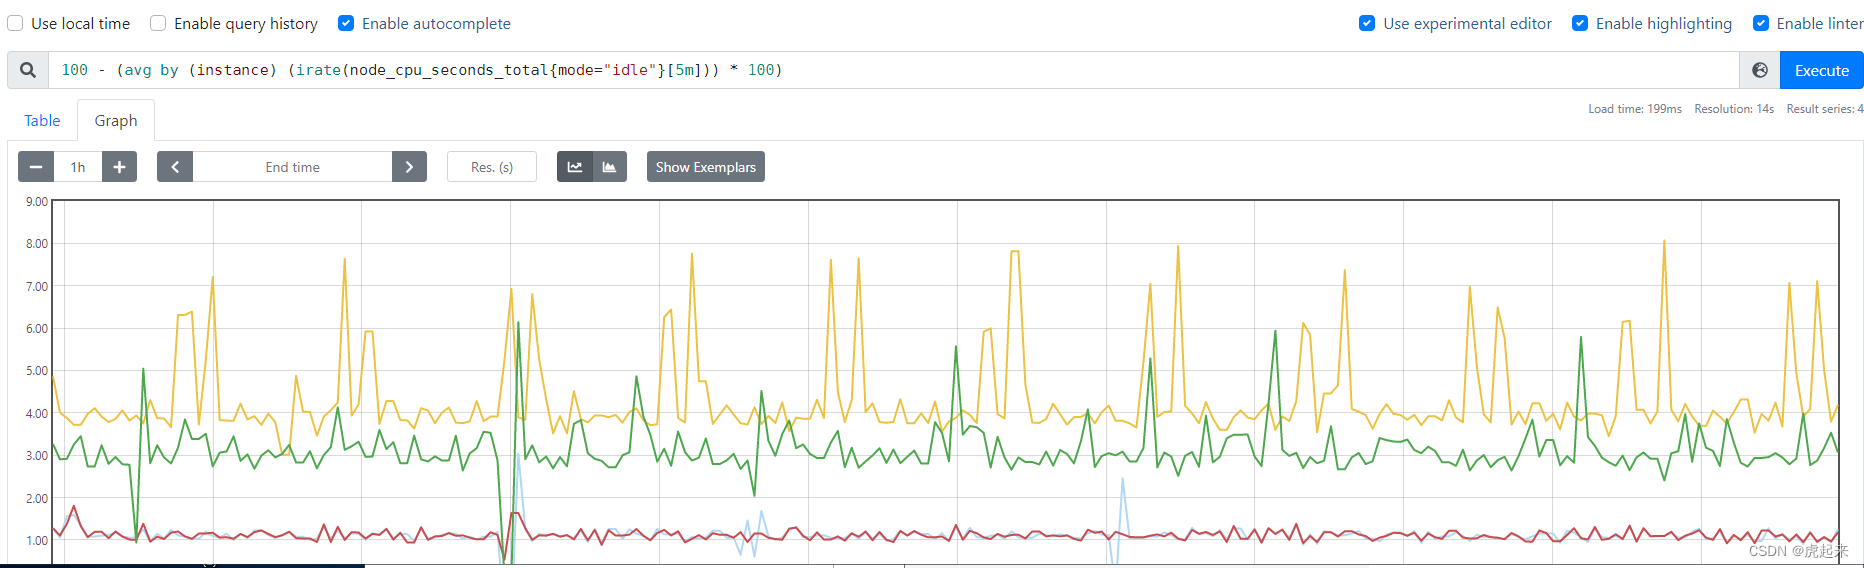
可以看到已经成功监控了集群的cpu
其他的常用监控如:
4.收集系统CPU监控信息
4.1 CPU使用率 公式:100 – (avg by (instance) (irate(node_cpu_seconds_total{mode=“idle”}[5m])) * 100)4.2 CPU负载 公式:
1分钟负载:node_load1
5分钟负载:node_load5
15分钟负载:node_load15
5.收集系统内存监控信息
5.1 内存使用率 公式:(1 – (node_memory_MemAvailable_bytes / node_memory_MemTotal_bytes ))* 1005.2 可用内存(单位:M) 公式:node_memory_MemAvailable_bytes / 1024 / 1024
6.收集系统磁盘监控信息
6.1 磁盘总大小(单位: G) 公式:node_filesystem_size_bytes {fstype=~“ext4|xfs”} / 1024 / 1024 / 10246.2 磁盘剩余大小(单位: G) 公式:node_filesystem_avail_bytes {fstype=~“ext4|xfs”} / 1024 / 1024 / 1024
6.3 磁盘使用率 公式:(1-(node_filesystem_free_bytes{fstype=~“ext4|xfs”} / node_filesystem_size_bytes{fstype=~“ext4|xfs”})) * 100
7.收集系统网络监控信息(ip add 查看网卡信息)
7.1 网卡入网流量 (指定某一个网卡) 公式:irate(node_network_receive_bytes_total{device=‘ens33’}[5m])7.2 网卡出网流量(指定某一个网卡) 公式:irate(node_network_transmit_bytes_total{device=‘ens33’}[5m])