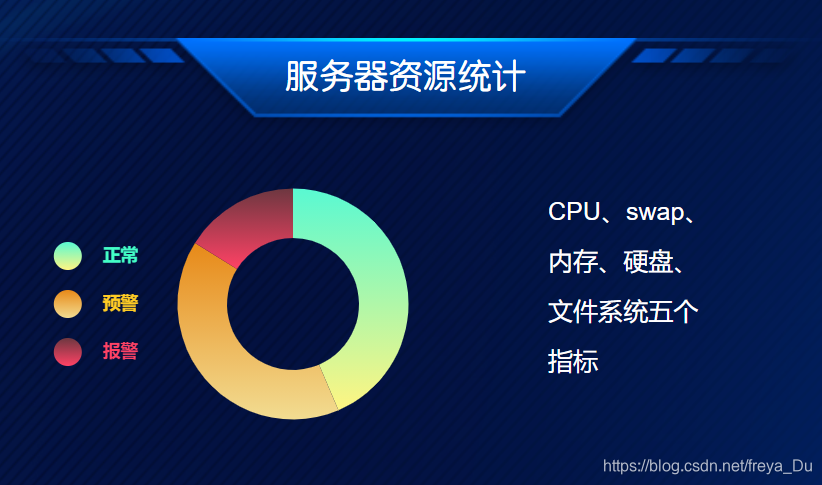
先看一下echarts图表效果
图表只要resize就会随着页面比例的变化而变化,但是图表中的标识字不可以哦,官方api不接受rem,vh,vw来调整字体大小。
有两种解决办法,第一种是监听页面元素,根据屏幕大小来调整文字的大小,在resize里面重绘。
第二种办法就是我下面代码里面的方法,通过把fontsize设置成百分比的样式来等比例调整图表。
<template>
  <div class="contain">
    <el-row>
      <el-col :span="16">
        <div id="pieCharts" ref="pieCharts" class="pieCharts"></div>
      </el-col>
      <el-col :span="5" class="text-resource">CPU、swap、内存、硬盘、文件系统五个指标</el-col>
    </el-row>
  </div>
</template>

<script>
import echarts from 'echarts'
export default {
  name: 'rightResource',
  data() {
    return {}
  },
  mounted() {
    var pieCharts = this.$echarts.init(document.getElementById('pieCharts'))

    let options = {
      tooltip: {
        trigger: 'item',
        formatter: '{a} <br/>{b}: {c} ({d}%)'
      },
      legend: {
        // orient: 'horizontal',
        orient: 'vertical',
        left: '10%',
        top: 'middle',
        data: [
          {
            name: '正常',
            textStyle: {
              fontSize: '80%',
              fontWeight: 'bolder',
              color: '#43fec7'
            },
            icon: 'circle' // 指示标样式
          },
          {
            name: '预警',
            textStyle: {
              fontSize: '80%',
              fontWeight: 'bolder',
              color: '#ffcc24'
            },
            icon: 'circle' // 指示标样式
          },
          {
            name: '报警',
            textStyle: {
              fontSize: '80%',
              fontWeight: 'bolder',
              color: '#ff4265'
            },
            icon: 'circle' // 指示标样式
          }
        ]
      },
      series: [
        {
          name: '服务器资源',
          type: 'pie',
          radius: ['40%', '70%'],
          top: 0,
          left: 30,
          avoidLabelOverlap: false,
          itemStyle: {
            borderRadius: 40,
            borderWidth: 1
          },
          label: {
            normal: {
              show: false,
              position: 'center'
            },
            emphasis: {
              show: true,
              textStyle: {
                fontSize: '30',
                color: '#fff',
                fontWeight: 'bold'
              }
            }
          },
          labelLine: {
            normal: {
              show: false
            }
          },
          data: [
            {
              value: 335,
              name: '正常',
              itemStyle: {
                normal: {
                  // 渐变色
                  color: new echarts.graphic.LinearGradient(0, 1, 0, 0, [
                    {
                      offset: 0,
                      color: '#fff582'
                    },
                    {
                      offset: 1,
                      color: '#59f9d2'
                    }
                  ])
                }
              }
            },
            {
              value: 310,
              name: '预警',
              itemStyle: {
                normal: {
                  // 渐变色
                  color: new echarts.graphic.LinearGradient(0, 1, 0, 0, [
                    {
                      offset: 0,
                      color: '#f2dc91'
                    },
                    {
                      offset: 1,
                      color: '#e78918'
                    }
                  ])
                }
              }
            },
            {
              value: 124,
              name: '报警',
              itemStyle: {
                normal: {
                  // 渐变色
                  color: new echarts.graphic.LinearGradient(0, 1, 0, 0, [
                    {
                      offset: 0,
                      color: '#ff4265'
                    },
                    {
                      offset: 1,
                      color: '#6d3740'
                    }
                  ])
                }
              }
            }
          ]
        }
      ]
    }
   // 在这里是图表响应式的代码
    pieCharts.setOption(options)
    window.addEventListener('resize', function() {
      pieCharts.resize()
    })
  }
}
</script>

<style scope lang='less'>
.container {
  .text-resource {
    text-align: left;
    font-size: 0.16rem;
    font-weight: 500;
    height: 100%;
    line-height: 2;
    vertical-align: middle;
    padding-right: 0.1rem;
    padding-top: 0.3rem;
    color: #fff;
  }
  .pieCharts {
    height: 2.1rem;
    width: 3.5rem;
    margin: 0 auto;
  }
}
</style>
版权声明:本文为freya_Du原创文章,遵循 CC 4.0 BY-SA 版权协议,转载请附上原文出处链接和本声明。