图片
html
<template>
  <div>
    <div ref="chart1" class="bh2"></div>
  </div>
</template>
js
<script setup>
import { ref, onMounted } from 'vue'
import * as echarts from 'echarts'
const chart1 = ref(null)
const chartclass = {
option: {
tooltip: {
trigger: 'item'
},
legend: {//图例组件
top: 'center',//图例组件离容器上侧的距离
right: '6%',//图例组件离容器右侧的距离
itemWidth: 14, // icon宽度
itemHeight: 14, // icon高度
itemGap: 15,//图例每项之间的间隔
icon: "circle",//图例项的icon
orient: 'vertical',//图例列表的布局朝向
textStyle: {//图例文字的样式
color: '#999999',//图例文字颜色
fontSize: 12//图例文字大小
},
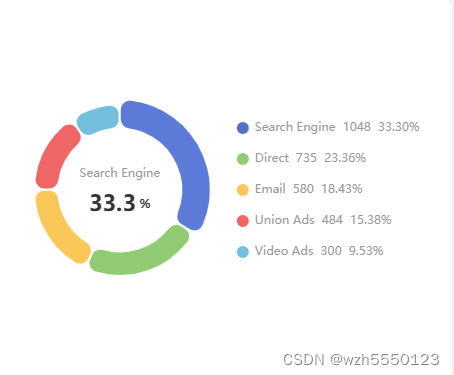
data: ['Search Engine', 'Direct', 'Email', 'Union Ads', 'Video Ads'],//图例的数据数组
formatter: function (name) {//图例文字的格式化器
var oa = chartclass.option.series[0].data;
var num = oa[0].value + oa[1].value + oa[2].value + oa[3].value + oa[4].value;
for (var i = 0; i < chartclass.option.series[0].data.length; i++) {//循环图例的数据数组
if (name == oa[i].name) {
return name + ' ' + oa[i].value + ' ' + (oa[i].value / num * 100).toFixed(2) + '%';
}
}
},
},
series: [
{
name: 'Access From',//系列名称
type: 'pie',//图表类型
radius: ['50%', '70%'],//饼图的半径,数组的第一项是内半径,第二项是外半径
avoidLabelOverlap: false,//是否为圆环图,设置为 true 之后扇区边缘会相接
width: '54%',//组件的宽度
// left : '10',//组件离容器左侧的距离
// top : 'center',//组件离容器上侧的距离
itemStyle: {//图形样式
borderRadius: 10,//圆角
borderColor: '#fff',//描边颜色
borderWidth: 2//描边宽度
},
label: {//饼图图形上的文本标签,可用于说明图形的一些数据信息,比如值,名称等。
show: false,//是否显示标签
position: 'center',// 标签的位置
fontSize: 12,//字体大小
fontWeight: 'normal',// 字体粗细 'normal' 'bold' 'bolder' 'lighter' 100 | 200 | 300 | 400...
formatter: '{b|{b}}\n{d|{d}} %',//富文本标签 {a}:系列名。 {b}:数据名。 {c}:数据值。 {d}:百分比。
fontStyle: 'normal',//字体样式 normal:正常 italic:斜体 oblique:倾斜
fontFamily: 'Microsoft YaHei',//字体系列 'serif' 'monospace' 'Arial' 'Courier New' 'Microsoft YaHei'...
rich: {//富文本标签
b: {
color: '#999999',//文本颜色
lineHeight: 30,//行高
align: 'center'//文本水平对齐方式
},
d: {
color: '#333333',//文本颜色
fontSize: 22, //字体大小
lineHeight: 33, //行高
// align: 'center',//文本水平对齐方式
fontWeight: 'bold'// 字体粗细
}
}
},
emphasis: {//高亮的扇区和标签样式
label: {//图形上的文本标签
show: true,//是否显示标签
fontSize: 12,//字体大小
fontWeight: 'bold',// 字体粗细
fontStyle: 'normal',//字体样式
fontFamily: 'Microsoft YaHei',//字体系列
color: '#333333',//文本颜色
rich: {//富文本标签
b: {
color: '#999999',//文本颜色
lineHeight: 30,//行高
align: 'center'//文本水平对齐方式
},
d: {
color: '#333333',//文本颜色
fontSize: 22, //字体大小
lineHeight: 33, //行高
// align: 'center',//文本水平对齐方式
fontWeight: 'bold'// 字体粗细
}
}
}
},
labelLine: {//标签的视觉引导线样式
show: false//是否显示标签的视觉引导线
},
data: [//数据数组
{ value: 1048, name: 'Search Engine' },
{ value: 735, name: 'Direct' },
{ value: 580, name: 'Email' },
{ value: 484, name: 'Union Ads' },
{ value: 300, name: 'Video Ads' }
]
}
]
},
chartfn: (dom) => {
let myChart = echarts.init(dom);
// console.log(chartclass.option);
chartclass.option && myChart.setOption(chartclass.option);
//解决没有高亮默认显示的问题 (第一次不显示中间文字问题)--------------------------------------------------------------
// 默认高亮第一条数据
let timer = setTimeout(() => {//延迟一秒设置默认高亮,防止动画bug
myChart.dispatchAction({//设置默认高亮
type: 'highlight',//highlight downplay 两个方法 一个高亮 一个取消高亮
dataIndex: 0
})
clearTimeout(timer)
}, 1000)
// 监听鼠标滑入事件
myChart.on('mouseover', (e) => {
// 鼠标滑入取消整个系列高亮
console.log(e,'23333');
myChart.dispatchAction({
type: 'downplay',//highlight downplay 两个方法 一个高亮 一个取消高亮
seriesIndex: e.seriesIndex
})
// 然后高亮鼠标悬停的那块
myChart.dispatchAction({
type: 'highlight',//highlight downplay 两个方法 一个高亮 一个取消高亮
dataIndex: e.dataIndex
})
})
// 监听鼠标滑出事件
myChart.on('mouseout', (e) => {
// 鼠标滑出取消整个系列所有高亮
myChart.dispatchAction({
type: 'downplay',//highlight downplay 两个方法 一个高亮 一个取消高亮
seriesIndex: e.seriesIndex
})
// 然后高亮鼠标最后悬停的那块
myChart.dispatchAction({
type: 'highlight',//highlight downplay 两个方法 一个高亮 一个取消高亮
dataIndex: e.dataIndex
})
})
//解决没有高亮默认显示的问题--------------------------------------------------------------
}
}
onMounted(() => {
chartclass.chartfn(chart1.value)
})
</script>
版权声明:本文为wzh5550123原创文章,遵循 CC 4.0 BY-SA 版权协议,转载请附上原文出处链接和本声明。