demo 地址: https://github.com/iotjin/jh-uniapp-demo
习惯使用echarts图表,在uniapp中使用npm安装echarts再使用,或多或少有问题,最终找到一个好用的插件
lime-echart


安装
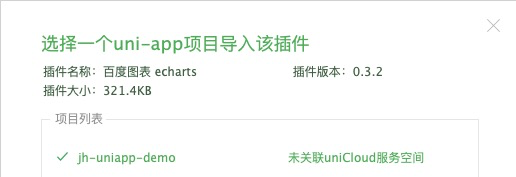
直接在插件市场,使用HBuilderX导入插件即可,最终导入到uni_modules文件夹
使用
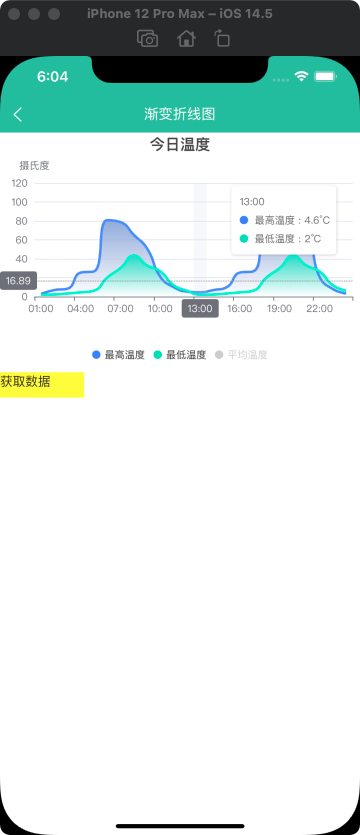
使用方法可参考插件市场的用法,以下是一个异步加载demo
<template>
	<view>
		<view style="width: 100%; height:500rpx">
			<l-echart ref="myChart1"></l-echart>
		</view>
		<view class="btn" @click="onClick">获取数据</view>
	</view>
</template>

<script>
	import * as echarts from '@/uni_modules/lime-echart/components/lime-echart/echarts';
	import lEchart from '@/uni_modules/lime-echart/components/lime-echart/'
	export default {
		components: {
			lEchart
		},
		data() {
			return {
				title: "柱状图-异步加载2",
			}
		},
		onLoad() {
			uni.setNavigationBarTitle({
				title: this.title
			})
		},
		onReady() {
			this.init_echarts1();
			setTimeout(() => {
				this.requestData()
			}, 1000);
		},
		methods: {
			onClick() {
				console.log();
				this.requestData();
			},
			//初始化图表
			init_echarts1() {
				var chartData = {
					title: "某地区蒸发量和降水量",
					legendData: ["蒸发量", "降水量"],
					xData: ["1月", "2月", "3月", "4月", "5月", "6月", "7月", "8月", "9月", "10月", "11月", "12月"],
					seriesData: [],
				};
				this.$refs.myChart1.init(config => {
					const {
						canvas
					} = config;
					const chart = echarts.init(canvas, null, config);
					canvas.setChart(chart);
					chart.setOption(this.getOption1(chartData));
					// 需要把 chart 返回
					return chart;
				});
			},
			//图表配置
			getOption1(chartData) {
				var option = {
					color: ["#3398DB", "#EB5E5E"],
					title: {
						left: "center",
						text: chartData ? chartData.title : "默认标题",
					},
					grid: {
						left: "3%",
						right: "2%",
						containLabel: true,
					},
					dataZoom: [{
						preventDefaultMouseMove: false,
						moveOnMouseWheel: false,
						type: 'inside'
					}],
					//坐标轴触发,。   'item'  , 'axis' ,'none'
					tooltip: {
						trigger: "axis",
					},
					//图例
					legend: {
						bottom: 10,
						itemWidth: 8,
						itemHeight: 8,
						data: chartData.legendData,
					},
					// xAxis: [
					//   {
					//     data: chartData.xData,
					//     axisLabel: {
					//       interval: 0,//可以设置成 0 强制显示所有标签。
					//     },
					//   },
					// ],
					// yAxis: {},
					xAxis: [{
						type: 'category',
						axisTick: false,
						//  改变x轴颜色
						axisLine: {
							lineStyle: {
								color: '#f0f0f0',
							}
						},
						// 字体样式
						axisLabel: {
							interval: 0, //可以设置成 0 强制显示所有标签。
							fontSize: 10,
							color: '#333333'
						},
						// 数据显示区域 线的颜色
						splitLine: {
							lineStyle: {
								color: '#f0f0f0',
							}
						},
						position: 'bottom',
						data: chartData.xData
					}],
					yAxis: [{
						name: chartData.yUnit ? chartData.yUnit : '',
						min: function(value) {
							return parseInt(value.min * 0.8 - 1);
							// return (value.min * 0.8).toFixed(2);
						},
						max: function(value) {
							return parseInt(value.max * 1.2 + 1);
							// return (value.max * 1.2).toFixed(2);
						},
						nameTextStyle: {
							fontSize: 12,
							color: '#999999'
						},
						axisTick: false,
						//  改变x轴颜色
						axisLine: {
							show: true,
							lineStyle: {
								color: '#f0f0f0',
							}
						},
						// 字体样式
						axisLabel: {
							margin: 2,
							show: true,
							interval: 'auto',
							fontSize: 10,
							color: '#333333'
						},
						// 数据显示区域 线的颜色
						splitLine: {
							lineStyle: {
								color: '#f0f0f0',
							}
						}
					}],
					series: chartData.seriesData,
				};
				return option;
			},
			requestData() {
				this.$refs.myChart1.showLoading()
				var dataArr = [{
						name: "蒸发量",
						data: [2.0, 4.9, 7.0, 23.2, 25.6, 76.7, 135.6, 162.2, 32.6, 20.0, 6.4, 3.3, ],
						barGap: 0,
						barMaxWidth: 6,
					},
					{
						name: "降水量",
						data: [2.6, 5.9, 9.0, 26.4, 28.7, 70.7, 175.6, 182.2, 48.7, 18.8, 6.0, 2.3, ],
						barGap: 0,
						barMaxWidth: 6,
					},
				];
				for (var i = 0; i < dataArr.length; i++) {
					var dic = dataArr[i];
					dic["type"] = "bar";
					dic["label"] = {
						show: true, //开启显示
						position: "top", //在上方显示
						distance: i == 0 ? 5 : 10,
						// rotate: 15,
						// offset: [20, 0],
						formatter: function(val) {
							if (val.value !== 0) {
								return val.value;
							} else {
								return "";
							}
						},
						fontSize: 12,
						color: "black",
					};
				}
				var chartData = {
					title: "某地区蒸发量和降水量",
					legendData: ["蒸发量", "降水量"],
					xData: ["1月", "2月", "3月", "4月", "5月", "6月", "7月", "8月", "9月", "10月", "11月", "12月"],
					seriesData: dataArr,
				};
				setTimeout(() => {
					this.$refs.myChart1.setOption(this.getOption1(chartData), true);
					this.$refs.myChart1.hideLoading()
				}, 1000);
			},
		},
	}
</script>

<style>
	.btn {
		width: 100px;
		height: 30px;
		background: yellow;
	}
</style>
版权声明:本文为iotjin原创文章,遵循 CC 4.0 BY-SA 版权协议,转载请附上原文出处链接和本声明。