机器学习——滑动窗口
滑动窗口,为了提升数据的准确性,将某个点的取值扩大到包含这个点的一段区间,用区间来进行判断,这个区间就是窗口。滑动窗口就是能够根据指定的单位长度来框住时间序列,从而计算框内的统计指标。相当于一个长度指定的滑块在刻度尺上面滑动,每滑动一个单位即可反馈滑块内的数据。
1、pandas里常用的滑动窗口函数:rolling
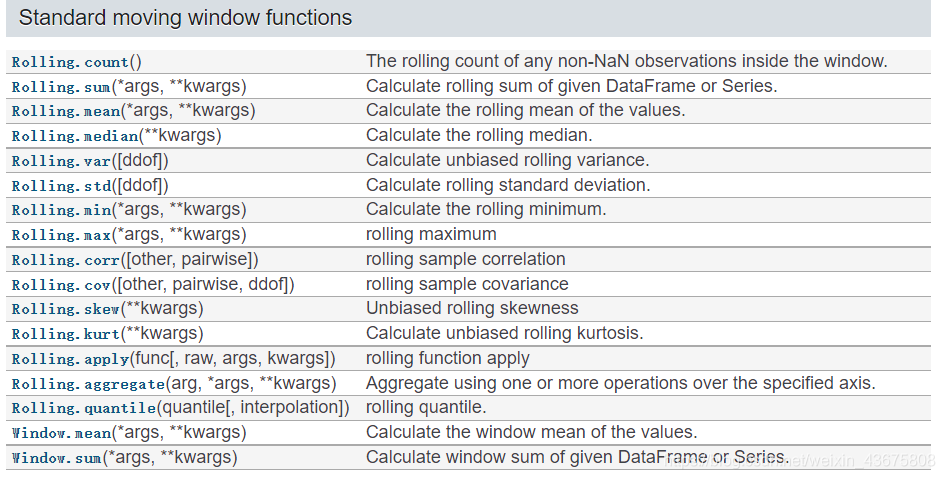
用法举例:
import numpy as np
import pandas as pd
import matplotlib.pyplot as plt

#数据准备
v = np.random.randn(200)
tx = pd.Series(v)
tx.index = pd.date_range('2018-1-01', periods = 200, freq = "d")
#print("tx", "-" * 20, "\n", tx)

w = np.random.randn(200)
ty = pd.Series(w)
ty.index = pd.date_range('2019-1-01', periods = 200, freq = "d")
#print("ty", "-" * 20, "\n", ty)
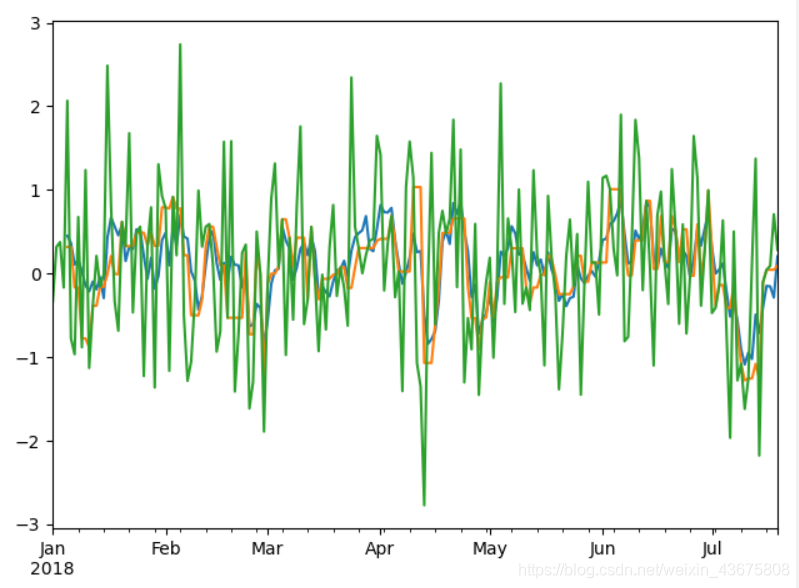
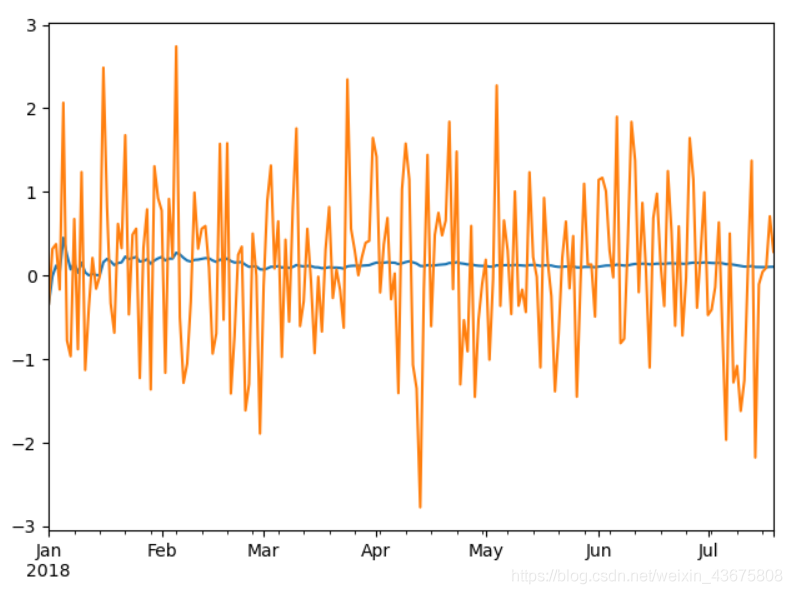
rm = tx.rolling(window = 5, center = False).mean()
rn = tx.rolling(window = 5, center = False).median()
rm.plot()
rn.plot()
tx.plot()
plt.show()
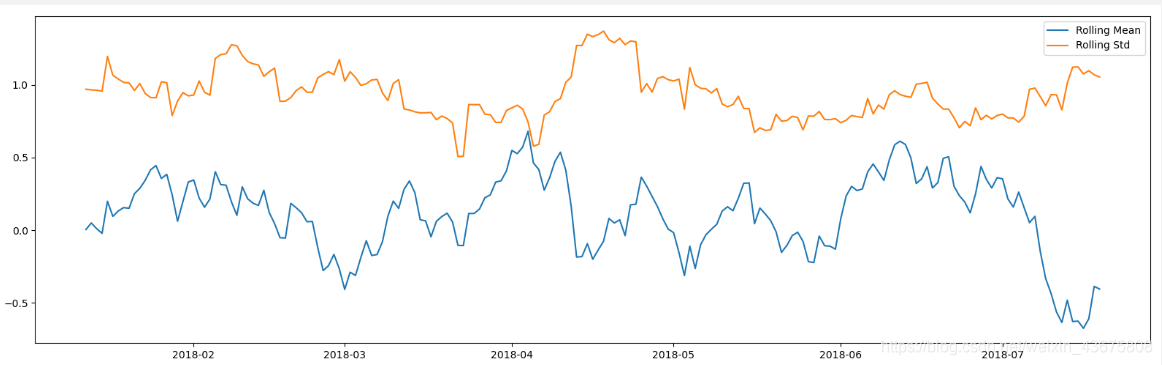
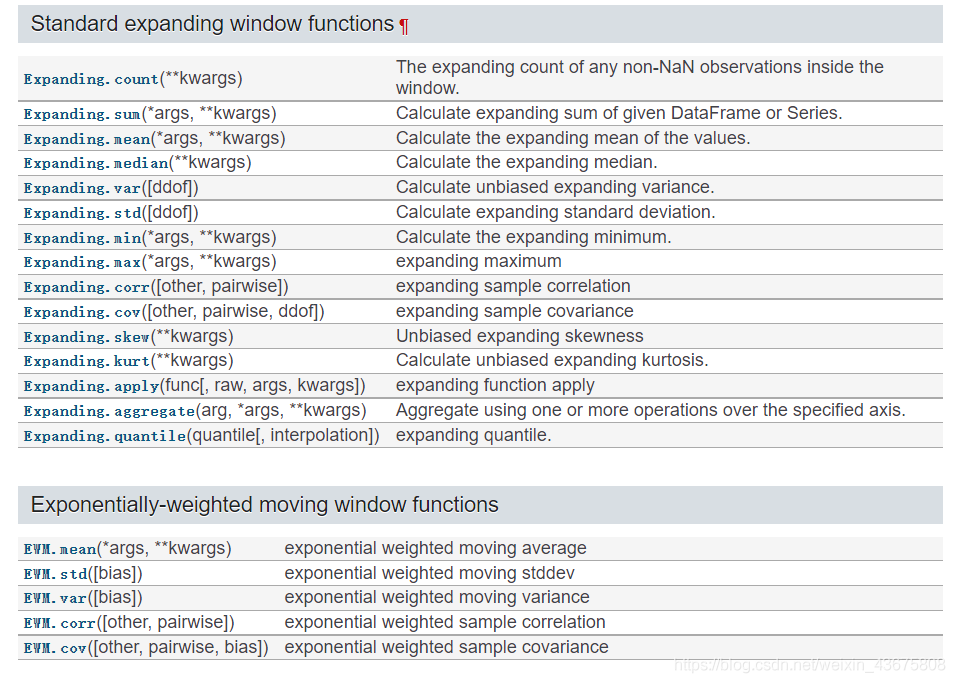
2、扩展滑动窗口函数:expanding()
该算子可以看做一个扩展的窗口,最开始窗口为1,聚合一次之后,窗口位置不变,但是大小增加1,直到窗口的覆盖整个序列:
eg:
a=tx.expanding().mean()
a.plot()
tx.plot()
plt.show()
3、指数加权函数滑动窗口:ewm()
ewm算子可以计算指数加权平均值的计算,具体的说来,就是更近观测的数值具有更高的权重,对于ewm指定权重的方式即指定跨度(span)
由于给近期的观测值更高的权重,与等权重相比,它对变化适应的更快

eg:
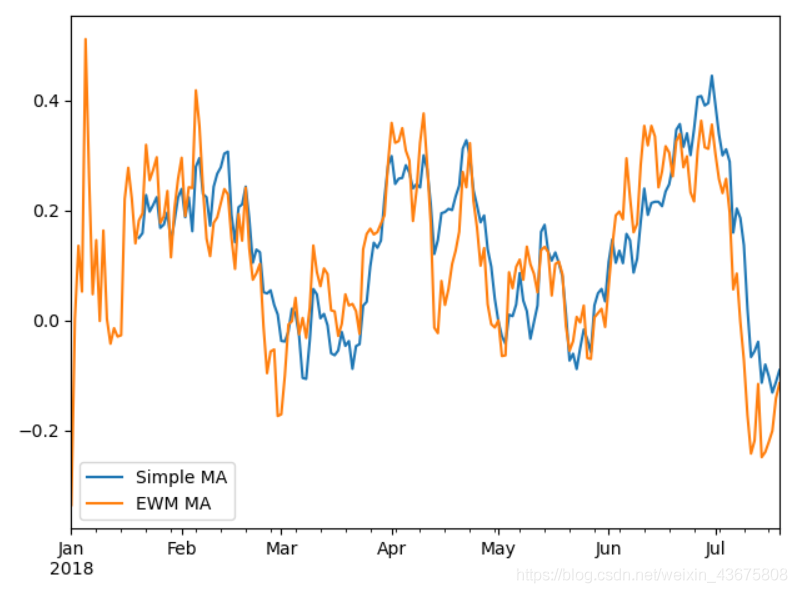
ma60 = tx.rolling(30,min_periods=20).mean()
#简单平均
ewma60 = tx.ewm(span=30).mean()
#指数加权平均
ma60.plot(label="Simple MA")
ewma60.plot(label="EWM MA")
plt.legend()
plt.show()
4、二元移动窗口函数
eg:
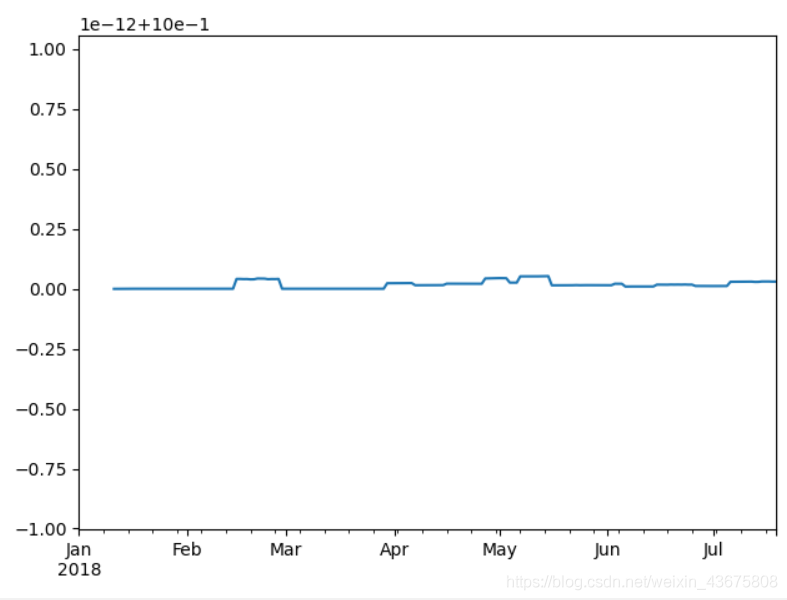
spx_rets = tx.pct_change()
returns = tx.pct_change()
#在我们调用rolling后,corr聚合函数会去计算spx_rets的滚动相关性(rolling correlation)
corr = returns.rolling(30,min_periods=10).corr(spx_rets)
corr.plot()
plt.show()
5、用户定义的移动窗口函数:rolling_apply()
- 通过
rolling().apply()方法,可以在移动窗口上使用自己定义的函数。
from scipy.stats import percentileofscore
score_at_2percent = lambda x:percentileofscore(x,0.02)
result = returns['AAPL'].rolling(window=250).apply(score_at_2percent)
result.plot(figsize=(10,3))
版权声明:本文为weixin_43675808原创文章,遵循 CC 4.0 BY-SA 版权协议,转载请附上原文出处链接和本声明。