1. 安装
npm install vis
2. 封装成组件
<template>
  <div :id="id" style="width: 100%; height: 100%"></div>
</template>
<script>
import vis from "vis";
let options;
export default {
  data() {
    return {
      network: "",
    };
  },
  props: {
    id: {
      type: String,
      required: true,
    },
    edges: {
      type: Array,
      default: () => [
        { from: 1, to: 3 },
        { from: 1, to: 2 },
        { from: 2, to: 4 },
        { from: 2, to: 5 }
      ]
    },
    nodes: {
      type: Array,
      default: () => [
        { id: 1, label: "Node 1" },
        { id: 2, label: "Node 2" },
        { id: 3, label: "Node 3" },
        { id: 4, label: "Node 4" },
        { id: 5, label: "Node 5" }
      ]
    }
  },
  watch: {
    nodes() {
      this.updateVisTopology()
    }
  },
  mounted() {
    this.createVisTopology();
  },
  methods: {
    //  创建一个vis拓扑图
    createVisTopology() {
      // create an array with nodes
      let nodes = new vis.DataSet(this.nodes);

      // create an array with edges
      let edges = new vis.DataSet(this.edges);

      // provide the data in the vis format
      let data = {
        nodes: nodes,
        edges: edges,
      };
      options = {
        //节点样式
        nodes: {
          shape: "box", //设置节点node样式为矩形 可选值:ellipse | circle | database | box | text
          fixed: false, //节点node固定不可移动
          font: {
            color: "white", //字体的颜色
            size: 30, //显示字体大小
          },
          scaling: {
            min: 16,
            max: 32, //缩放效果比例
          },
        },
        //连接线的样式
        edges: {
          color: {
            color: "rgb(97, 168, 224)",
            highlight: "rgb(97, 168, 224)",
            hover: "green",
            inherit: "from",
            opacity: 1.0,
          },
          font: {
            align: "top", //连接线文字位置
          },
          smooth: true, //是否显示方向箭头
          arrows: { to: true }, //箭头指向from节点
        },
        layout: {
          //以分层方式定位节点
          hierarchical: {
            direction: "LR", //分层排序方向
            sortMethod: "directed", //分层排序方法
            levelSeparation: 400, //不同级别之间的距离
          },
        },
        interaction: {
          navigationButtons: true,
          hover: true, //鼠标移过后加粗该节点和连接线
          selectConnectedEdges: false, //选择节点后是否显示连接线
        },
      };

      // initialize your network!
      this.network = new vis.Network(document.getElementById(this.id),data,options);
    },
    updateVisTopology() {
      this.network.setData({
        nodes: this.nodes,
        edges: this.edges
      })
      // this.network.setOptions(options)
    }
  },
};
</script>
3. 组件使用
<template>
  <div style="width: 100%;height: 100%;">
    <div class="vis-container">
      <VisTopology :id="'VisTopology'" />
    </div>
  </div>
</template>
<script>
import VisTopology from './vis.vue'
export default {
  components: { VisTopology }
}
</script>
<style scoped>
.vis-container {
  width: 500px;
  height: 500px;
  border: 1px solid red;
}
</style>
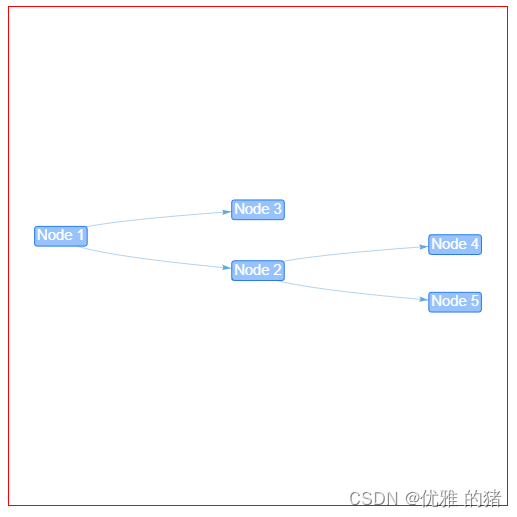
效果图

版权声明:本文为m0_51431448原创文章,遵循 CC 4.0 BY-SA 版权协议,转载请附上原文出处链接和本声明。