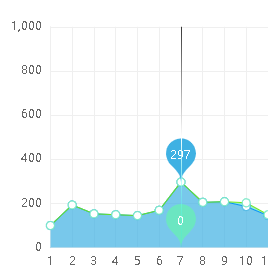
echarts 鼠标悬停事件 点强调显示 折线图 showTip

  • Post author:
  • Post category:其他


1,效果图

在这里插入图片描述


2,描述

当鼠标停留在横坐标7的时候,着重显示横坐标7的两个图标的纵坐标数据


3,代码


  <div class="layui-col-md6 bl">
      <div id="main1" class="biao"></div>
  </div>
                    

var option1 = {
          color: ["#3fb1e3", "#6be6c1", "#626c91", "#a0a7e6", "#c4ebad", "#96dee8"],
          tooltip: {
              trigger: 'axis',
              backgroundColor: '#fff',
              textStyle: {
                  color: '#333',
                  align: 'left',
              },
              axisPointer: {
                  lineStyle: {
                      color: {
                          type: 'linear',
                          x: 0,
                          y: 0,
                          x2: 0,
                          y2: 1,
                          colorStops: [{
                              offset: 0,
                              color: '#333'
                          }, {
                              offset: 0.5,
                              color: 'rgba(255, 255, 255,1)',
                          }, {
                              offset: 1,
                              color: 'rgba(0, 255, 233,0)'
                          }],
                          global: false
                      }
                  },
              },
              formatter: function(arg) {

              }
          },
          title: {
              text: '月度数据上报',
              x: 'center',
              textStyle: {
                  fontSize: 16,
                  fontWeight: 'bolder',
                  color: '#333'          // 主标题文字颜色
              },
          },
          grid: {
              left: '4%',
              right: '8%',
              bottom: '10%',
              top: '20%',
              containLabel: true,
          },
          legend: {
              show: true,
              x: 'right',
              top: '7%',
              y: '35',
              textStyle: {
                  color: '#1bb4f6',
              },
              data: ['上报数', '填报数'],
          },
          xAxis: [
              {
                  name: '日',
                  type: 'category',
                  boundaryGap: false,
                  axisLabel: {
                      color: '#666',
                  },
                  axisLine: {
                      show: true,
                      lineStyle: {
                          color: '#efefef',
                      },
                  },
                  axisTick: {
                      show: false,
                  },
                  splitLine: {
                      show: true,
                      lineStyle: {
                          color: '#efefef',
                      },
                  },
                  data: ['1', '2', '3', '4', '5', '6', '7', '8', '9', '10', '11', '12','13', '14', '15', '16', '17', '18', '19', '20', '21', '22', '23', '24', '25', '26', '27', '28', '29', '30', '31'],
              },
          ],
          yAxis: [
              {
                  type: 'value',
                  min: 0,
                  max: 1000,
                  axisLabel: {
                      formatter: '{value}',
                      textStyle: {
                          color: '#666',
                      },
                  },
                  axisLine: {
                      lineStyle: {
                          color: '#efefef',
                      },
                  },
                  axisTick: {
                      show: false,
                  },
                  splitLine: {
                      show: true,
                      lineStyle: {
                          color: '#efefef',
                      },
                  },
              },
          ],
          series: [
              {
                  name: '上报数',
                  type: 'line',
                  stack: 'Total',
                  areaStyle: {},
                  symbolSize: 8,
                  itemStyle: {
                      normal: {
                          lineStyle: {
                              color: '#0092f6',
                              width: 1,
                          },
                          areaStyle: {
                              color: '#3fb1e3'

                          },
                      },
                  },
                  markPoint: {
                      data: [
                          // { xAxis: '1', yAxis: '100',name: 'num',value:100},
                      ]
                  },
                  data:sbmdata,
              },

              {
                  name: '填报数',
                  type: 'line',
                  stack: 'Total',
                  areaStyle: {},
                  symbolSize: 8,
                  itemStyle: {
                      normal: {
                          lineStyle: {
                              color: '#6FE81A',
                              width: 1,
                          },
                          areaStyle: {
                              color: '#6be6c1'
                          },
                      },
                  },
                  markPoint: {
                      data: [
                              // { xAxis: '1', yAxis: '0',name: 'num',value:0},
                          ]
                  },
                  data:tbmdata,
              },
          ],
     };


//初始化渲染加载数据
   var myChart1 = echarts.init(document.getElementById('main1'));
    myChart1.setOption(option1);
    

//操作实现的核心代码
//showTip显示提示框操作
    myChart1.on('showTip',function (params) {
        // console.log(JSON.stringify(params))
        option1.series[0].markPoint.data.splice(0,option1.series[0].markPoint.data.length);//清空数组
        option1.series[1].markPoint.data.splice(0,option1.series[1].markPoint.data.length);//清空数组
        xindex=params.dataIndex
        var sbdata=sbmdata[params.dataIndex]
        option1.series[0].markPoint.data.push({ xAxis: xindex, yAxis: sbdata.value, name: 'num',value: sbdata.value});
        var tbdata=tbmdata[params.dataIndex]
        option1.series[1].markPoint.data.push({ xAxis: xindex, yAxis: tbdata.value, name: 'num',value: tbdata.value});

        //重新渲染
        echarts.init(document.getElementById('main1')).setOption(option1);
    });


版权声明:本文为qq_36636312原创文章,遵循 CC 4.0 BY-SA 版权协议,转载请附上原文出处链接和本声明。