普罗米修斯+grafana 监控工具搭建步骤 –详细
搭建步骤
一、prometheus搭建步骤
官网下载二进制包:https://prometheus.io/download/
1.下载二进制包
wget https://github.com/prometheus/prometheus/releases/download/v2.36.0/prometheus-2.36.0.linux-amd64.tar.gz
2.下载完之后在服务器中进行解压
tar -xzvf prometheus-2.36.0.linux-amd64.tar.gz
3. 解压后将prometheus添加systemd管理:
有的机器修改的是 /usr/lib/systemd/system/ 这里面···
我修改的是在/etc/systemd/system/
注意,里面的“–web.listen-address=:80” 我说将启动的默认端口9090修改成了80端口,这里需要注意,若不需要修改的,将80修改成9090即可。(也要注意里面的yml文件路径是否一致)
[root@zishan666 ~]# cat /etc/systemd/system/prometheus.service
[Unit]
Description=Prometheus
Documentation=https://prometheus.io/
After=network.target

[Service]
Type=simple
User=root
ExecStart=/usr/local/prometheus/prometheus --web.listen-address=:80 --config.file=/usr/local/prometheus/prometheus.yml --web.enable-lifecycle --storage.tsdb.path=/usr/local/prometheus/data --storage.tsdb.retention=60d
Restart=on-failure

[Install]
WantedBy=multi-user.target
4. 修改prometheus配置文件:
[root@zishan666 prometheus]# pwd
/usr/local/prometheus

[root@zishan666 prometheus]# cat prometheus.yml
# my global config
global:
  scrape_interval: 15s # Set the scrape interval to every 15 seconds. Default is every 1 minute.
  evaluation_interval: 15s # Evaluate rules every 15 seconds. The default is every 1 minute.
  # scrape_timeout is set to the global default (10s).

# Alertmanager configuration
alerting:
  alertmanagers:
    - static_configs:
        - targets:
          # - alertmanager:9093     # 开启alertmanager告警,去掉 # 号即可

# Load rules once and periodically evaluate them according to the global 'evaluation_interval'.
rule_files:
  # - "first_rules.yml"    # prometheus读取监控的数据文件
  # - "second_rules.yml"

# A scrape configuration containing exactly one endpoint to scrape:
# Here it's Prometheus itself.
scrape_configs:
  # The job name is added as a label `job=<job_name>` to any timeseries scraped from this config.
  - job_name: "prometheus"

    # metrics_path defaults to '/metrics'
    # scheme defaults to 'http'.

    static_configs:
      - targets: ["120.26.90.57:80"].
  - job_name: "nodes"
    static_configs:
    - targets: ["120.26.90.57:9100"]    # 监控 node_exporter 数据,主要监控node节点数据(内存,cpu,负载等)
以上的yml文件要注意 static_configs: 下面的ip需要修改成对应的ip,nodes下面填写client客户端的ip,端口记得修改。
5. 加载配置并启动
systemctl daemon-reload
systemctl start prometheus.service
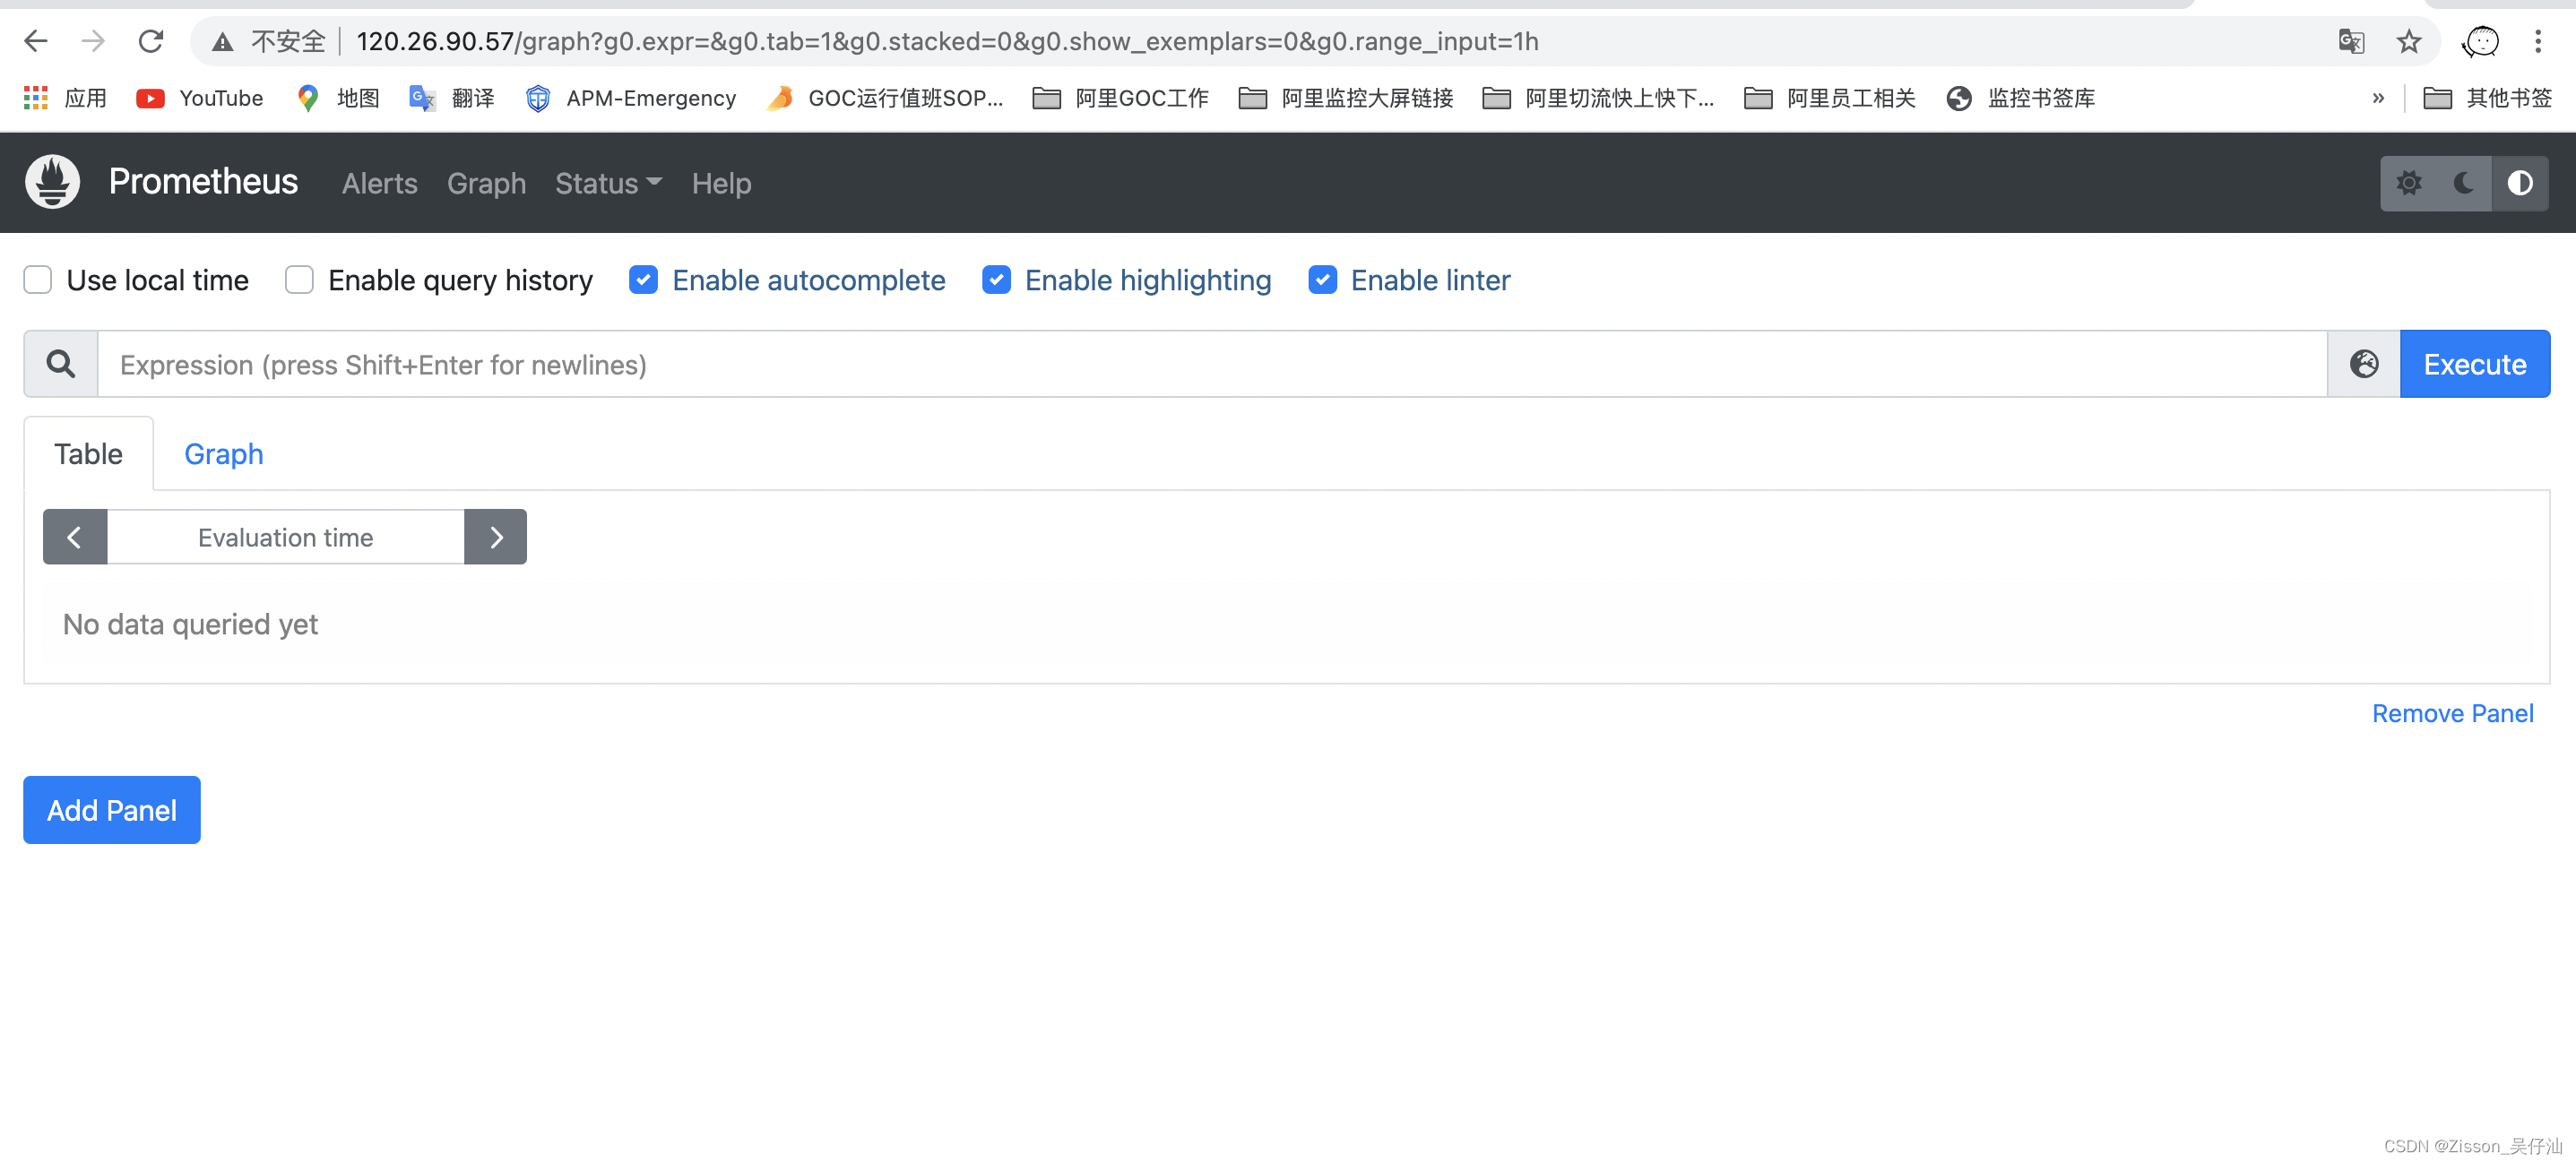
6. 访问web页面成功
http://120.26.90.57:9090/graph
二、node_exporter的部署
1.下载二进制文件
下载网址: https://prometheus.io/download/
wget https://github.com/prometheus/node_exporter/releases/download/v1.3.1/node_exporter-1.3.1.linux-amd64.tar.gz
2. 解压并移动到指定目录
tar xzvf node_exporter-1.3.1.linux-amd64.tar.gz
mv node_exporter-1.3.1.linux-amd64 node_exporter
cp -r /root/test/node_exporter  /usr/local/
3. 添加systemd管理
[root@zishan666 html]# cat /etc/systemd/system/node_exporter.service
[Unit]
Description=node_exportier
After=network.target
[Service]
Type=simple
User=root
ExecStart=/usr/local/node_exporter/node_exporter
Restart=on-failure
[Install]
WantedBy=multi-user.target
4. 加载配置并启动
systemctl daemon-reload
systemctl start node_exporter
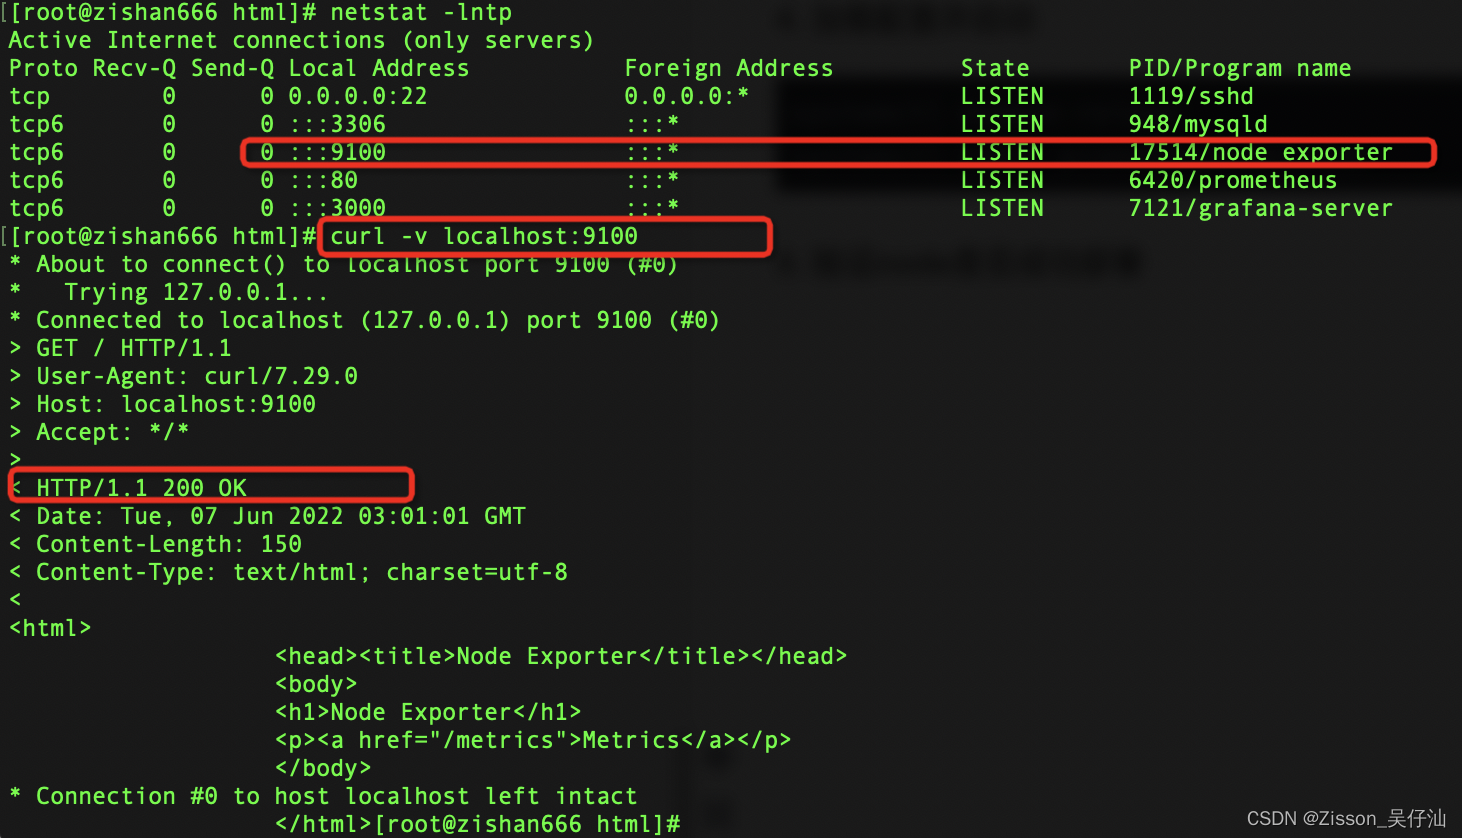
5. 验证node是否成功部署
三、grafana的部署流程
官网下载网址: https://grafana.com/grafana/download
1.下载二进制包并解压
wget https://dl.grafana.com/enterprise/release/grafana-enterprise-8.5.4.linux-amd64.tar.gz

cd /root/test/

tar -zxvf grafana-enterprise-8.5.4.linux-amd64.tar.gz
解压之后其实就可以打开grafana了,直接进入到bin目录下,/root/test/grafana/bin/ 然后 ./grafana-server 或
./grafana-server & 就执行了,我们也可以添加system快捷启动:
2. 添加systemd管理
[root@zishan666 test]# cat /etc/systemd/system/grafana.service
[Unit]
Description=grafana
[Service]
ExecStart=/root/test/grafana/bin/grafana-server -homepath=/root/test/grafana
ExecReload=/bin/kill -HUP $MAINPID
KillMode=process
Restart=on-failure
[Install]
WantedBy=multi-user.target
3.加载系统配置并启动
systemctl daemon-reload
systemctl start grafana.service
4. grafana 部署并启动成功

四、mysqld_exporter的搭建步骤
安装mysqld.exporter 之前你需要保证你服务器里面已经安装了mysql
1. 下载二进制包
下载网址: https://prometheus.io/download/
[root@Zisson ~]# wget https://github.com/prometheus/mysqld_exporter/releases/download/v0.14.0/mysqld_exporter-0.14.0.linux-amd64.tar.gz
2. 解压至指定目录
[root@Zisson ~]# tar xzf mysqld_exporter-0.14.0.linux-amd64.tar.gz -C /root/test/
3. 连接Mysql,打开权限。
mysqld_exporter需要连接到Mysql,打开Mysql的权限
[root@Zisson ~]# mysql -u root -p密码
mysql> grant all privileges on *.* to 'root'@'%' identified by 'WU@123456a' with grant option;
mysql> GRANT REPLICATION CLIENT,PROCESS ON *.* TO 'mysql_monitor'@'localhost' identified by 'WU@123456a';
mysql> GRANT SELECT ON *.* TO 'mysql_monitor'@'localhost';
mysql> flush privileges;
mysql> \q
4. 创建并编辑.my.cnf
[root@Zisson ~]# cat /usr/local/mysqld_exporter/.my.cnf
[client]
user=mysql_monitor
password=WU@123456a
可以选择直接后台启动:
nohup ./mysqld_exporter -config.my-cnf=.my.cnf &
#启动mysqld_exporter并后台运行
建议先cd到目录下再运行,这样nohup的日志就会存在当前目录,如果在系统根目录下运行,所有的nohup.out日志文件会混淆
5. 配置systemd快捷启动方式并启动
[root@Zisson ~]# cat /etc/systemd/system/mysqld_exporter.service
[Unit]

Descripton=mysqls_exporter server

Documentation=https://prometheus.io/docs/introduction/overview/

After=network.target

[Service]

Restart=on-failure

ExecStart=/usr/local/mysqld_exporter/mysqld_exporter --config.my-cnf=/usr/local/mysqld_exporter/.my.cnf --web.listen-address=:9104

[Install]
WantedBy=multi-user.target
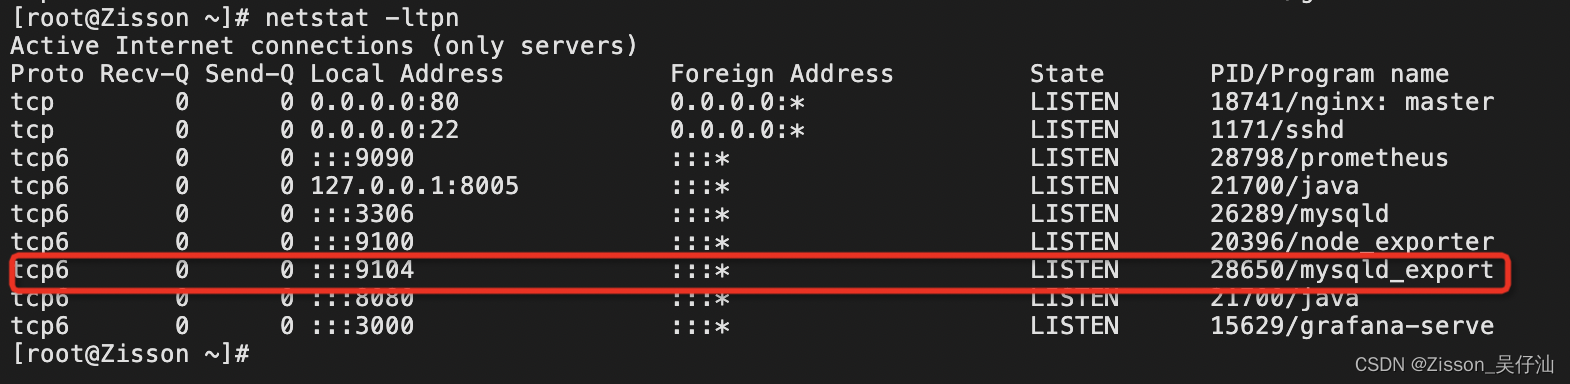
mysqld_exporter默认运行端口是:9104
[root@Zisson ~]# systemctl enable mysqld_exporter
[root@Zisson ~]# systemctl start mysqld_exporter
6. 配置修改Prometheus的prometheus.yml 文件
添加内容如下:
  - job_name: "mysqld_exporter"
    static_configs:
      - targets: ['120.26.57.23:9104']
7. 重启Prometheus,搭建完成!
注意:如果是在阿里云,记得开启阿里云安全组的9104端口

创作者:吴仔汕 Zisson
手工编辑,并实验测试过了的,觉得有效的请点个赞~
欢迎大家参考,还可以提出疑问或者不同看法噢。
原创作品,转载请标明出处!!
版权声明:本文为Zisson_no_error原创文章,遵循 CC 4.0 BY-SA 版权协议,转载请附上原文出处链接和本声明。