使用ReportLab绘制PDF
1. ReportLab 简介
这是一个软件库,可让您使用Python编程语言以Adobe的可移植文档格式(PDF)直接创建文档。它还以各种位图和矢量格式以及PDF创建图表和数据图形。Wikipedia,hp都在使用。
2. ReportLab功能
- 绘制图形(直线,圆,自定义图形)
- 自定义文字和编码(主要是英文,对中文不太友好)
- PDF页面框架布局自定义和模板定制(页眉,页脚)
- 段落(文字,样式定义)
- 表格及表格样式(合并单元格)
- 其他有用的Flowables(Preformatted: 段落,不折行, Image: 图片, Spacer: 空格)
- 绘制图表(条行图,折线图,饼图)
3. ReportLab 使用方案
- 直接调用方法,函数绘制PDF
- 使用ReportLab Markup Language(RML)绘制PDF
4. ReportLab安装
pip install reportlab (python)
5.注册中文字体
下载自己需要的.ttf字体,例如微软雅黑.ttf
    from reportlab.pdfbase import pdfmetrics
    from reportlab.pdfbase.ttfonts import TTFont

	pdfmetrics.registerFont(TTFont('hei', os.path.join(pdf_dir, "微软雅黑.ttf")))
6.文字,段落简单样式
def cost_static_style(**kwargs):
	    stylesheet1 = StyleSheet1()
	    stylesheet = getSampleStyleSheet()
	    font_size = 9
	    # font
	    fonts.addMapping('hei', 0, 0, 'hei')
	    fonts.addMapping('hei', 0, 1, 'hei')

	    # title_style
	    stylesheet1.add(
	        ParagraphStyle(name='title_style',
	                       parent=stylesheet['Title'],
	                       fontName='hei')
	    )
	    title_style = stylesheet1['title_style']

	    # cost_table_text_style
	    stylesheet1.add(
	        ParagraphStyle(name='cost_table_text_style',
	                       # parent=stylesheet['Normal'],             # parent 样式
	                       fontName='hei',                            # 字体
	                       fontSize=font_size,                        # 字号
	                       fontWeight='normal',                       #  是否加粗
	                       alignment=1)                               #  对齐样式(0:左对齐 1:居中 2:右对齐)
	    )
	    cost_table_text_style = stylesheet1['cost_table_text_style']

	    return {
			       'title_style': title_style,
			       'cost_table_text_style': cost_table_text_style
			   }
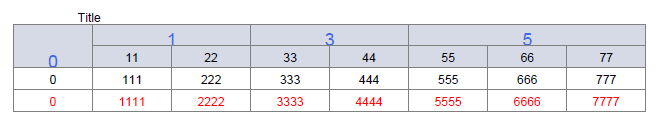
7.表格及表格样式
from reportlab.platypus import Paragraph, SimpleDocTemplate, Table,TableStyle
from reportlab.lib.units import inch
from reportlab.lib import colors

def table_model(data):
    width = 7.2  # 总宽度
    colWidths = (width / len(data[0])) * inch   # 每列的宽度

    dis_list = []
    for x in data:
        # dis_list.append(map(lambda i: Paragraph('%s' % i, cn), x))
        dis_list.append(x)

    style = [
        # ('FONTNAME', (0, 0), (-1, -1), 'song'),  # 字体
        ('FONTSIZE', (0, 0), (-1, 0), 15),  # 字体大小
        ('BACKGROUND', (0, 0), (-1, 0), HexColor('#d5dae6')),  # 设置第一行背景颜色
        ('BACKGROUND', (0, 1), (-1, 1), HexColor('#d5dae6')),  # 设置第二行背景颜色

        # 合并 ('SPAN',(第一个方格的左上角坐标),(第二个方格的左上角坐标)),合并后的值为靠上一行的值,按照长方形合并
        ('SPAN',(0,0),(0,1)),
        ('SPAN',(1,0),(2,0)),
        ('SPAN',(3,0),(4,0)),
        ('SPAN',(5,0),(7,0)),

        ('ALIGN', (0, 0), (-1, -1), 'CENTER'),  # 对齐
        ('VALIGN', (-1, 0), (-2, 0), 'MIDDLE'),  # 对齐
        ('LINEBEFORE', (0, 0), (0, -1), 0.1, colors.grey),  # 设置表格左边线颜色为灰色,线宽为0.1
        ('TEXTCOLOR', (0, 0), (-1, 0), colors.royalblue),  # 设置表格内文字颜色
        ('TEXTCOLOR', (0, -1), (-1, -1), colors.red),  # 设置表格内文字颜色
        ('GRID', (0, 0), (-1, -1), 0.5, colors.grey),  # 设置表格框线为grey色,线宽为0.5
    ]

    component_table = Table(dis_list, colWidths=colWidths,style=style)

    return component_table

Style=getSampleStyleSheet()
n = Style['Normal']
data = [[0,1,2,3,4,5,6,7],
        [00,11,22,33,44,55,66,77],
        [000,111,222,333,444,555,666,777],
        [0000,1111, 2222, 3333, 4444, 5555, 6666, 7777],]

z = table_model(data
pdf = MyDocTemplate('ppff.pdf')
pdf.multiBuild([Paragraph('Title',n),z])
8.段落
Paragraph('(一)订单交期: ', cost_table_text_style)
9.图形
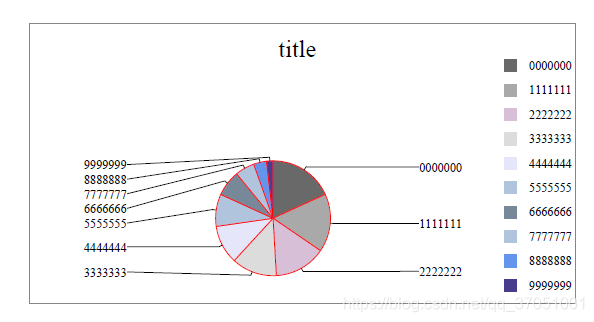
- 饼图
from reportlab.lib import colors
from reportlab.platypus import SimpleDocTemplate
from reportlab.graphics.shapes import Drawing, Rect
from reportlab.graphics.charts.textlabels import Label
from reportlab.graphics.charts.piecharts import Pie

def autoLegender( chart,title=''):
    width = 448
    height = 230
    d = Drawing(width,height)
    lab = Label()
    lab.x = 220  #x和y是文字的位置坐标
    lab.y = 210
    lab.setText(title)
    # lab.fontName = 'song' #增加对中文字体的支持
    lab.fontSize = 20
    d.add(lab)
    d.background = Rect(0,0,width,height,strokeWidth=1,strokeColor="#868686",fillColor=None) #边框颜色
    d.add(chart)

    return d


def draw_pie(data=[], labels=[], use_colors=[], width=360,):
    '''更多属性请查询reportlab.graphics.charts.piecharts.WedgeProperties'''

    pie = Pie()
    pie.x = 60 # x,y饼图在框中的坐标
    pie.y = 20
    pie.slices.label_boxStrokeColor = colors.white  #标签边框的颜色

    pie.data = data      # 饼图上的数据
    pie.labels = labels  # 数据的标签
    pie.simpleLabels = 0 # 0 标签在标注线的右侧;1 在线上边
    pie.sameRadii = 1    # 0 饼图是椭圆;1 饼图是圆形

    pie.slices.strokeColor = colors.red       # 圆饼的边界颜色
    pie.strokeWidth=1                         # 圆饼周围空白区域的宽度
    pie.strokeColor= colors.white             # 整体饼图边界的颜色
    pie.slices.label_pointer_piePad = 10       # 圆饼和标签的距离
    pie.slices.label_pointer_edgePad = 25    # 标签和外边框的距离
    pie.width = width
    pie.direction = 'clockwise'
    pie.pointerLabelMode  = 'LeftRight'
    # for i in range(len(labels)):
    #     pie.slices[i].fontName = 'song' #设置中文
    for i, col in enumerate(use_colors):
         pie.slices[i].fillColor  = col
    return pie


data = [10,9,8,7,6,5,4,3,2,1]
labs = ['0000000','1111111','2222222','3333333','4444444',
        '5555555','6666666','7777777','8888888','9999999']
color = [HexColor("#696969"),HexColor("#A9A9A9"),HexColor("#D8BFD8"),
         HexColor("#DCDCDC"),HexColor('#E6E6FA'),HexColor("#B0C4DE"),
         HexColor("#778899"),HexColor('#B0C4DE'),HexColor("#6495ED"),
         HexColor("#483D8B")
         ]
z = autoLegender(draw_pie(data,labs,color),labs,color)

pdf=SimpleDocTemplate('ppff.pdf')
pdf.multiBuild([z])
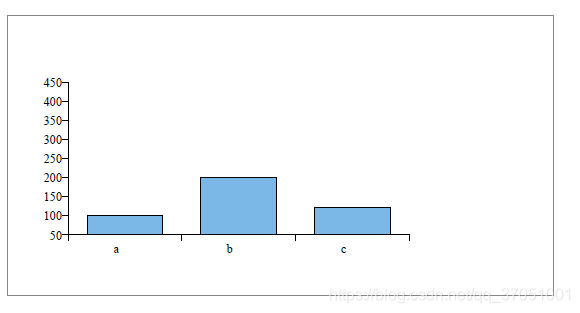
- 柱状图
from reportlab.graphics.charts.barcharts import VerticalBarChart
from reportlab.lib.colors import HexColor

def draw_bar_chart(min, max, x_list, data=[()], x_label_angle=0, bar_color=HexColor("#7BB8E7"), height=125, width=280):
    '''
    :param min: 设置y轴的最小值
    :param max: 设置y轴的最大值
    :param x_list: x轴上的标签
    :param data: y轴对应标签的值
    :param x_label_angle: x轴上标签的倾斜角度
    :param bar_color: 柱的颜色  可以是含有多种颜色的列表
    :param height: 柱状图的高度
    :param width: 柱状图的宽度
    :return:
    '''
    bc = VerticalBarChart()
    bc.x = 50            # x和y是柱状图在框中的坐标
    bc.y = 50
    bc.height = height  # 柱状图的高度
    bc.width = width    # 柱状图的宽度
    bc.data = data
    for j in xrange(len(x_list)):
        setattr(bc.bars[j], 'fillColor', bar_color)  # bar_color若含有多种颜色在这里分配bar_color[j]
    # 调整step
    minv = min * 0.5
    maxv = max * 1.5
    maxAxis = int(height/10)
    # 向上取整
    minStep = int((maxv-minv+maxAxis-1)/maxAxis)

    bc.valueAxis.valueMin = min * 0.5      #设置y轴的最小值
    bc.valueAxis.valueMax = max * 1.5      #设置y轴的最大值
    bc.valueAxis.valueStep = (max-min)/4   #设置y轴的最小度量单位
    if bc.valueAxis.valueStep < minStep:
        bc.valueAxis.valueStep = minStep
    if bc.valueAxis.valueStep == 0:
        bc.valueAxis.valueStep = 1
    bc.categoryAxis.labels.boxAnchor = 'ne'   # x轴下方标签坐标的开口方向
    bc.categoryAxis.labels.dx = -5           # x和y是x轴下方的标签距离x轴远近的坐标
    bc.categoryAxis.labels.dy = -5
    bc.categoryAxis.labels.angle = x_label_angle   # x轴上描述文字的倾斜角度
    # bc.categoryAxis.labels.fontName = 'song'
    x_real_list = []
    if len(x_list) > 10:
        for i in range(len(x_list)):
            tmp = '' if i%5 != 0 else x_list[i]
            x_real_list.append(tmp)
    else:
        x_real_list = x_list
    bc.categoryAxis.categoryNames = x_real_list
    return bc

z = autoLegender(draw_bar_chart(100, 300, ['a', 'b', 'c'], [(100, 200, 120)]))
pdf=SimpleDocTemplate('ppff.pdf')
pdf.multiBuild([z])
10.页眉,页脚,模板
from reportlab.platypus.doctemplate import BaseDocTemplate, Frame
from reportlab.lib.units import cm
from reportlab.platypus import PageTemplate
from reportlab.lib.styles import getSampleStyleSheet
import os

def myMainPageFrame(canvas, doc):  # 全局应用
    "The page frame used for all PDF documents."
    canvas.saveState()
    canvas.setFont('Times-Roman', 12)
    pageNumber = canvas.getPageNumber()
    if pageNumber > 0:
        pic_yemei = os.path.join(os.path.dirname(__file__),'yemei01.jpg')   # 页眉图片
        pic_line_file = os.path.join(os.path.dirname(__file__),'line.jpg')  # 页眉线
        canvas.drawImage(pic_yemei, 75, 795, width=100,height=25)
        canvas.drawImage(pic_line_file, 75, 780, width=450, height=15)
        canvas.drawString(10*cm, cm, str(pageNumber))
    canvas.restoreState()

class MyDocTemplate(BaseDocTemplate):  # 自定义模版类
    "The document template used for all PDF documents."
    _invalidInitArgs = ('pageTemplates',)
    def __init__(self, filename, **kw):
        frame1 = Frame(2.5*cm, 2.5*cm, 15*cm, 25*cm, id='F1')
        self.allowSplitting = 0
        BaseDocTemplate.__init__(self, filename, **kw)
        template = PageTemplate('normal', [frame1], myMainPageFrame)
        self.addPageTemplates(template)   # 绑定全局应用

Style=getSampleStyleSheet()
n = Style['Normal']
z = autoLegender(draw_bar_chart(100, 300, ['a', 'b', 'c'], [(100, 200, 120)]))
pdf = MyDocTemplate('ppff.pdf')
pdf.multiBuild([Paragraph('Title',n),z])

12.KeepTogether(flowables)
此复合Flowable获取Flowable列表并尝试将它们保存在同一帧中。 如果
列表可流动图中Flowable的总高度超过当前帧的可用空间,然后全部
使用空间并强制帧中断(防止table,paragraph自动分页)。
13.Restful PDF接口设计
- 组装PDF内容数据函数
- 动态绘制PDF模板,加载数据(静态,动态样式分开,使用PDF封装模板)
- 设计PDF视图函数,返回PDF文件
- 提供PDF二进制文件GET接口
参考文档
-
ReportLab官网:
https://www.reportlab.com/
-
ReportLab文档地址:
https://www.reportlab.com/documentation/
版权声明:本文为qq_37051001原创文章,遵循 CC 4.0 BY-SA 版权协议,转载请附上原文出处链接和本声明。