一、第一章练习
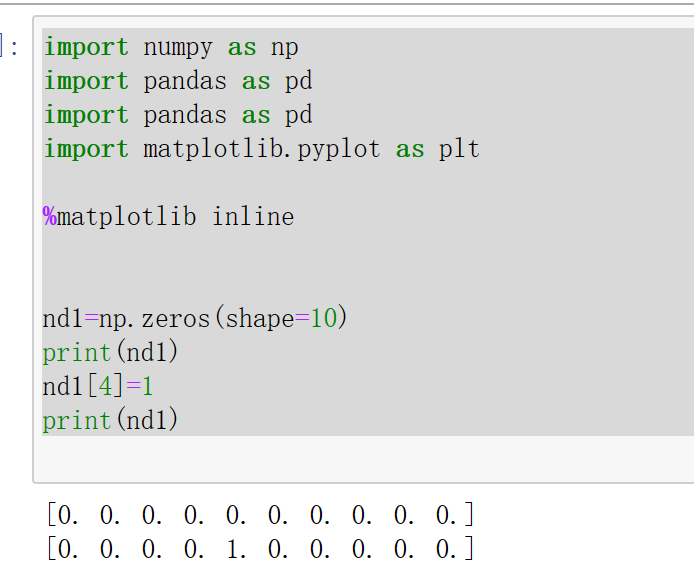
1、创建一个长度为10的一维全为0的ndarray对象,然后让第5个元素等于1
import numpy as np
import pandas as pd
import pandas as pd
import matplotlib.pyplot as plt

%matplotlib inline


nd1=np.zeros(shape=10)
print(nd1)
nd1[4]=1
print(nd1)
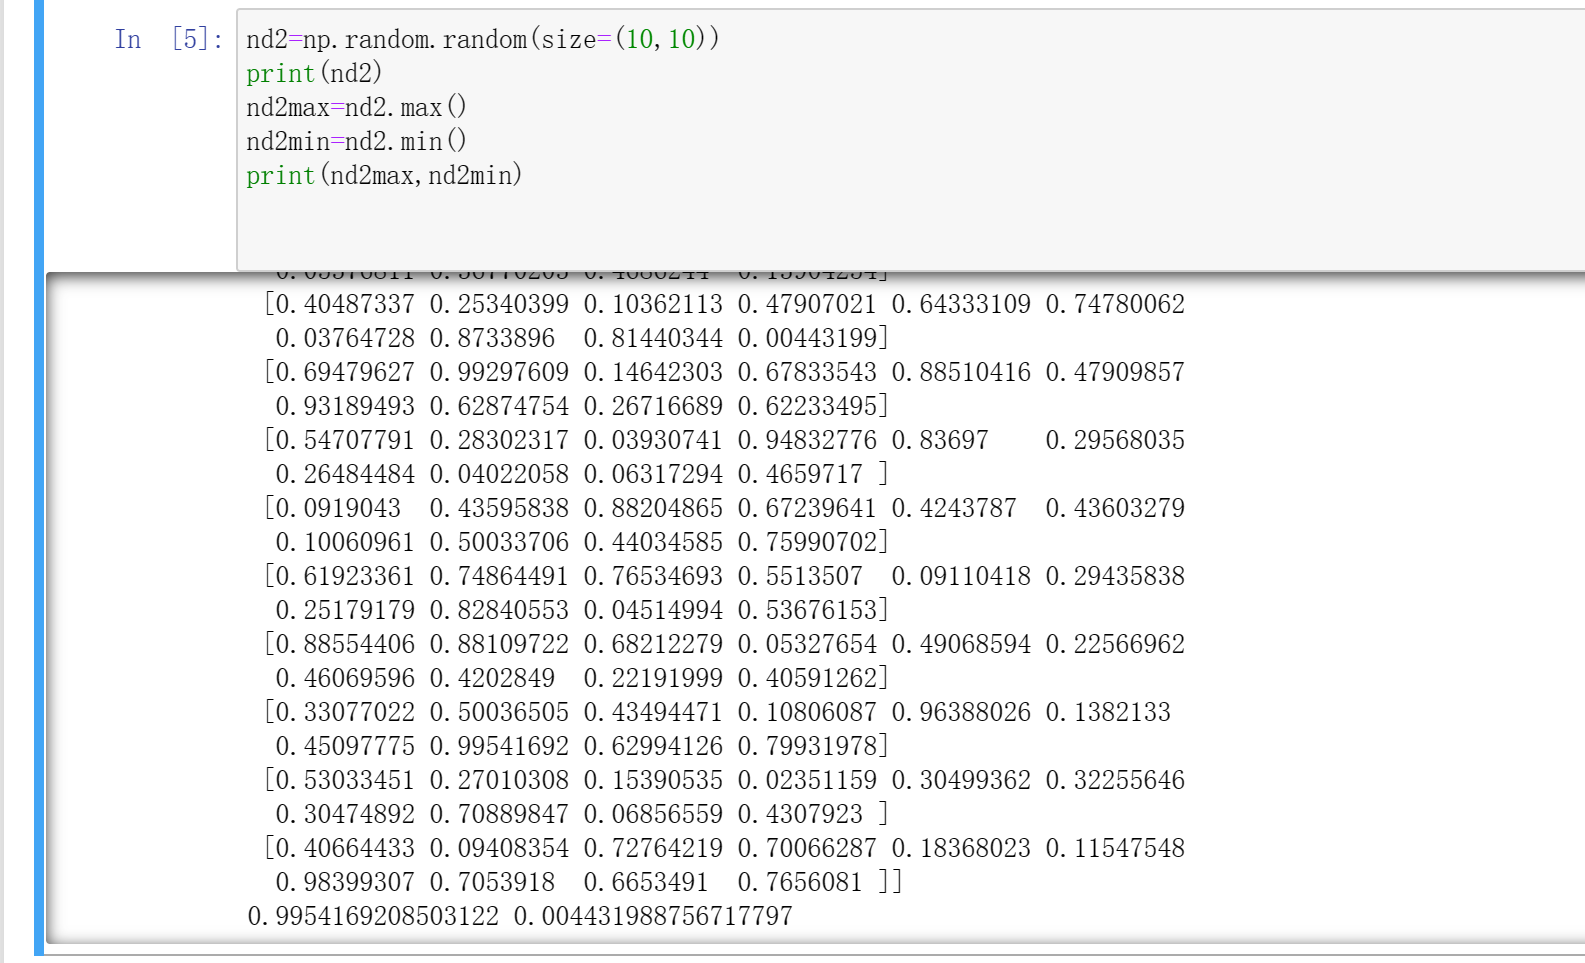
2、使用np.random.random创建一个10*10的ndarray对象,并打印出最大最小元素
nd2=np.random.random(size=(10,10))
print(nd2)
nd2max=nd2.max()
nd2min=nd2.min()
print(nd2max,nd2min)
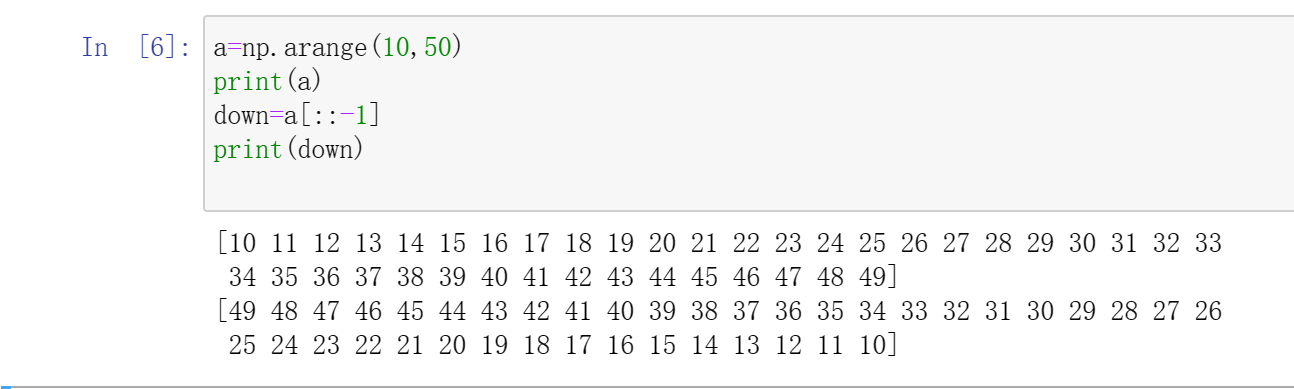
3、创建一个元素为从10到49的ndarray对象,并将所有元素位置反转
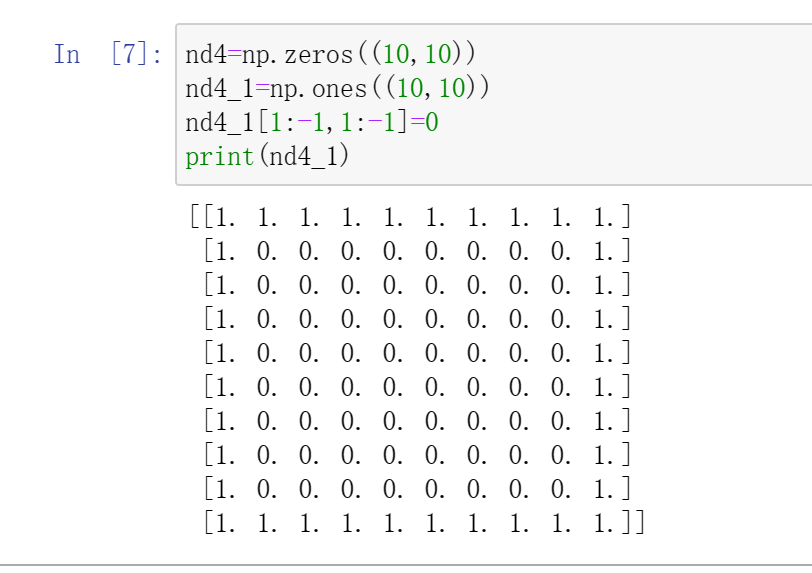
4、创建一个10*10的ndarray对象,且矩阵边界全为1,里面全为0
nd4=np.zeros((10,10))
nd4_1=np.ones((10,10))
nd4_1[1:-1,1:-1]=0
print(nd4_1)
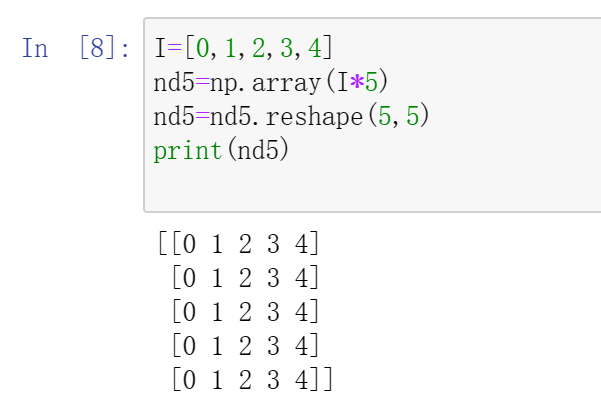
5、创建一个每一行都是从0到4的5*5矩阵
I=[0,1,2,3,4]
nd5=np.array(I*5)
nd5=nd5.reshape(5,5)
print(nd5)
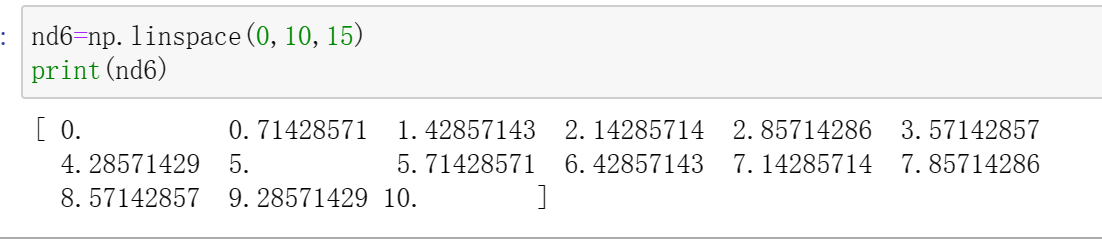
6、创建一个范围在(0,10)之间的长度为15的等差数列
nd6=np.linspace(0,10,15)
print(nd6)
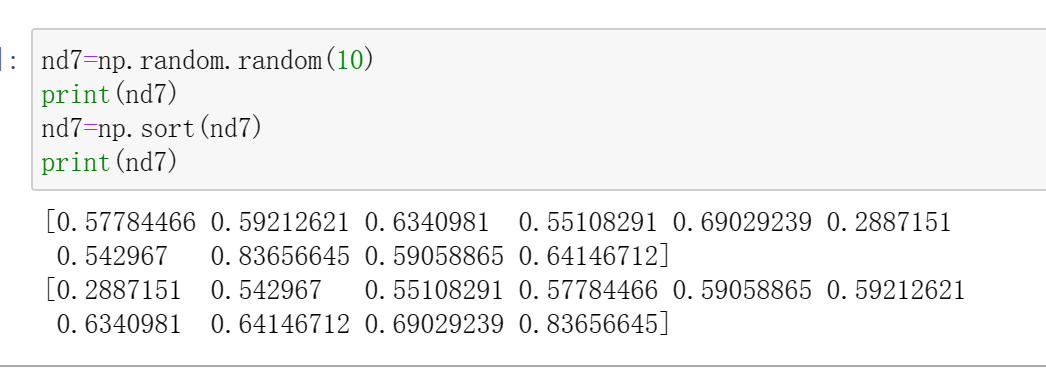
7、创建一个长度为10的随机数组并排序
nd7=np.random.random(10)
print(nd7)
nd7=np.sort(nd7)
print(nd7)
二、第二章练习
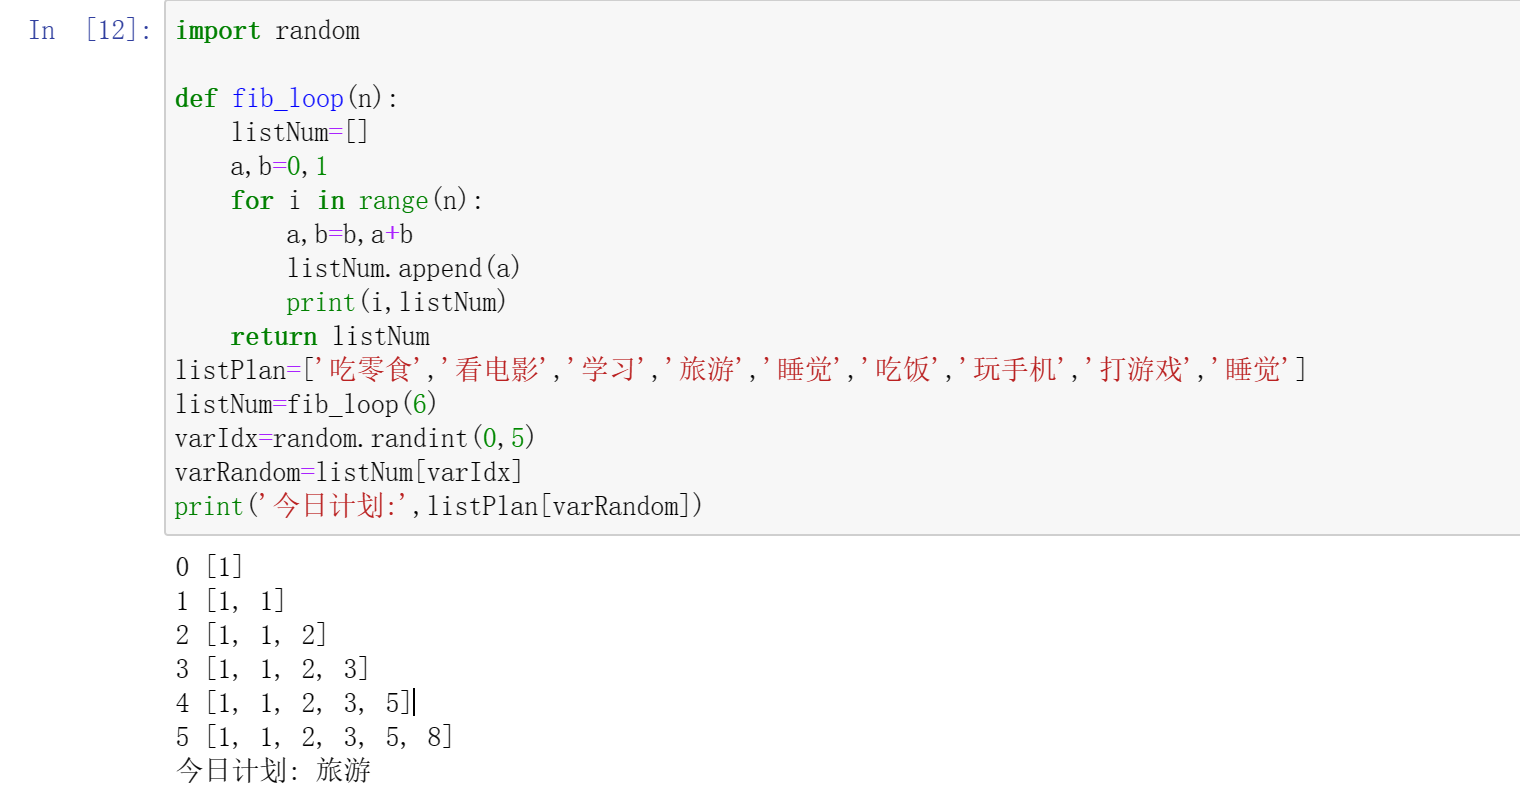
1、
import random
def fib_loop(n):
listNum=[]
a,b=0,1
for i in range(n):
a,b=b,a+b
listNum.append(a)
print(i,listNum)
return listNum
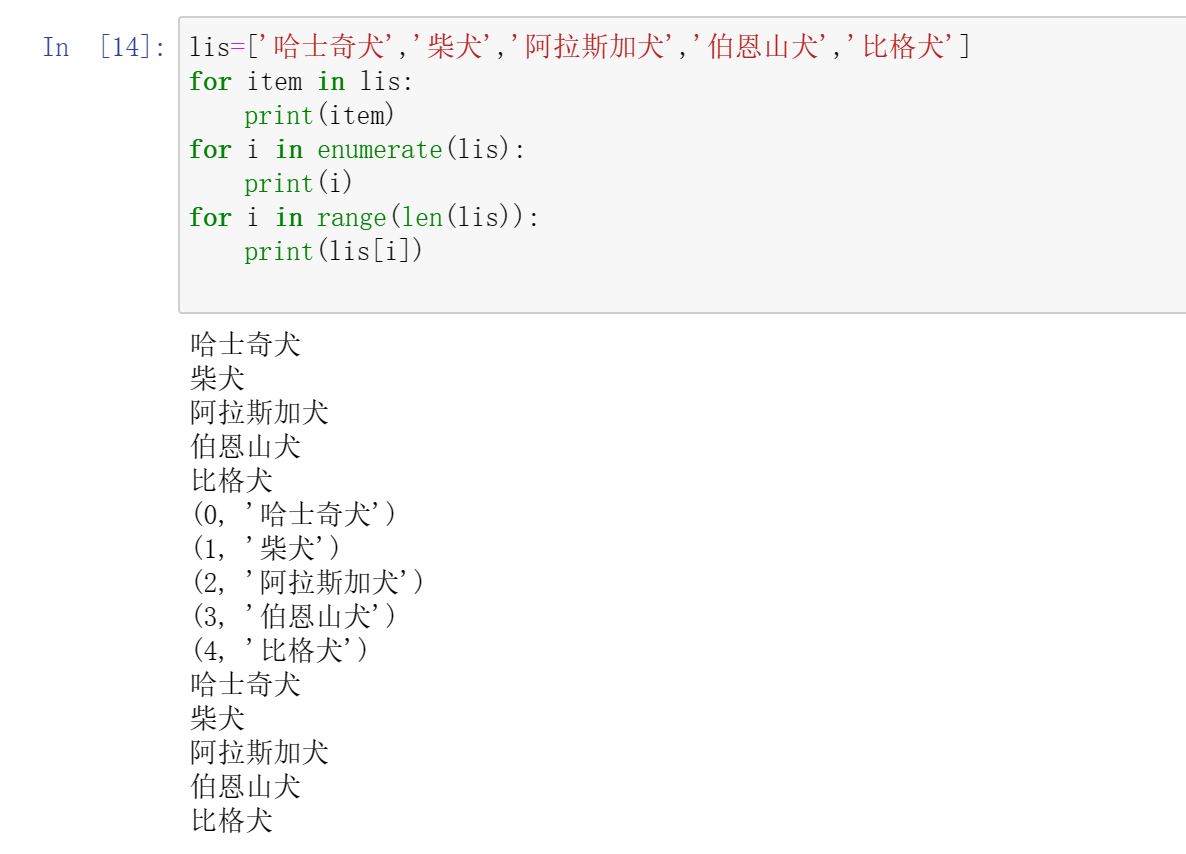
listPlan=['吃零食','看电影','学习','旅游','睡觉','吃饭','玩手机','打游戏','睡觉']
listNum=fib_loop(6)
varIdx=random.randint(0,5)
varRandom=listNum[varIdx]
print('今日计划:',listPlan[varRandom])
2、
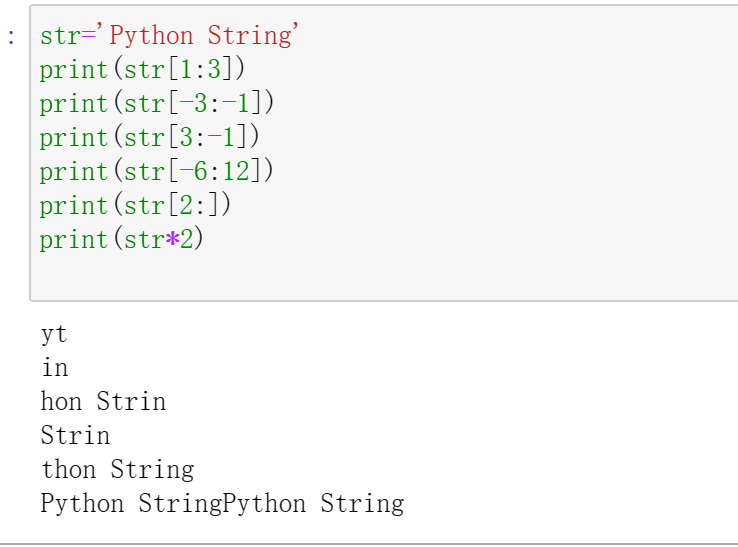
str='Python String'
print(str[1:3])
print(str[-3:-1])
print(str[3:-1])
print(str[-6:12])
print(str[2:])
print(str*2)
3、
4、
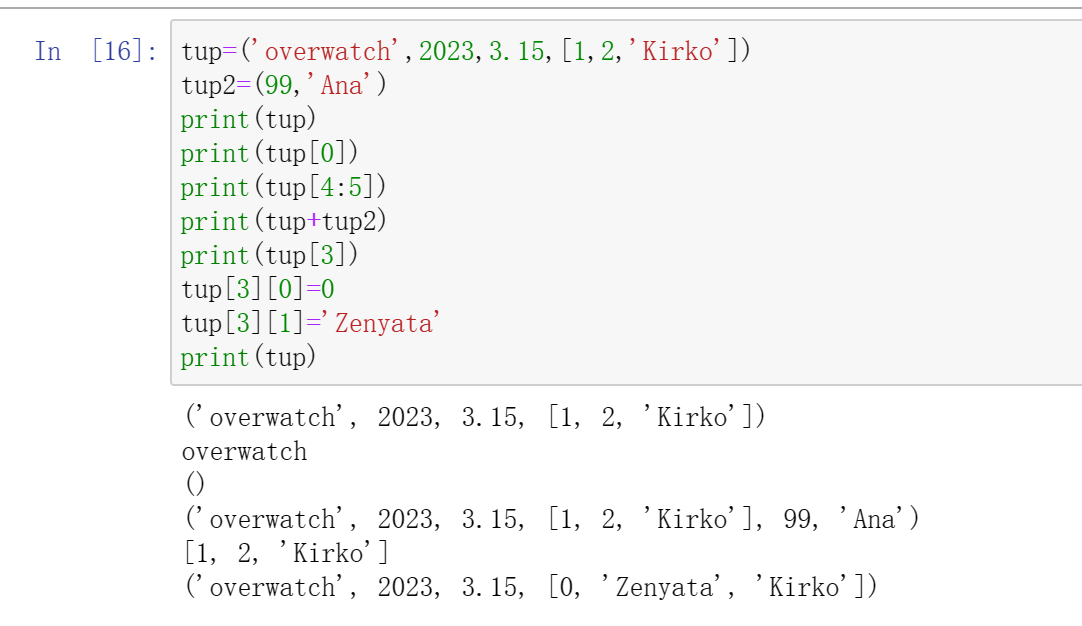
tup=('overwatch',2023,3.15,[1,2,'Kirko'])
tup2=(99,'Ana')
print(tup)
print(tup[0])
print(tup[4:5])
print(tup+tup2)
print(tup[3])
tup[3][0]=0
tup[3][1]='Zenyata'
print(tup)
5、
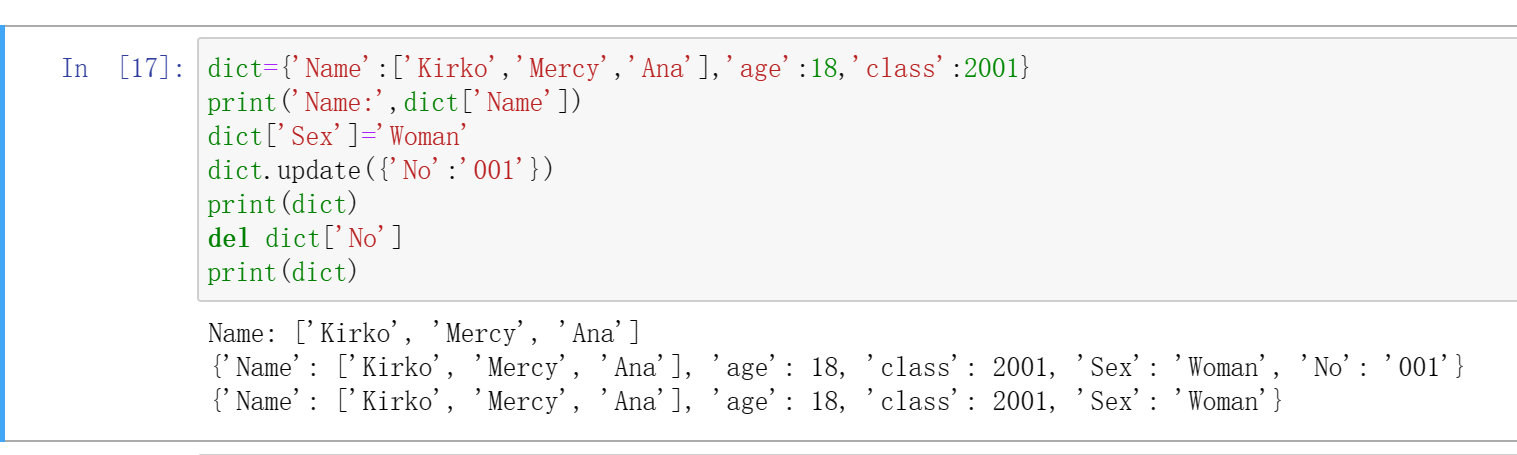
dict={'Name':['Kirko','Mercy','Ana'],'age':18,'class':2001}
print('Name:',dict['Name'])
dict['Sex']='Woman'
dict.update({'No':'001'})
print(dict)
del dict['No']
print(dict)
三、第三章练习
numpy库练习
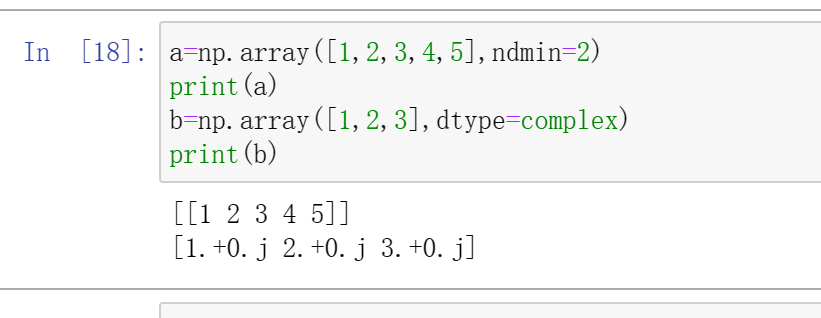
1、
a=np.array([1,2,3,4,5],ndmin=2)
print(a)
b=np.array([1,2,3],dtype=complex)
print(b)
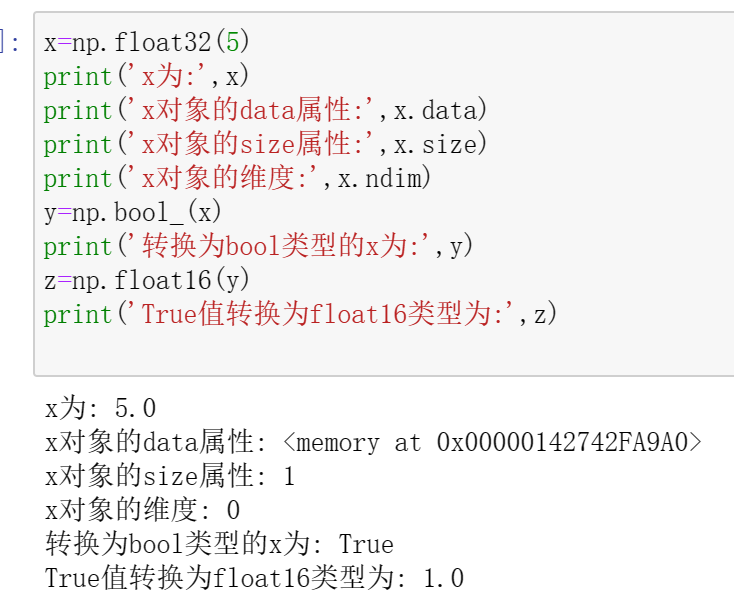
2、
x=np.float32(5)
print('x为:',x)
print('x对象的data属性:',x.data)
print('x对象的size属性:',x.size)
print('x对象的维度:',x.ndim)
y=np.bool_(x)
print('转换为bool类型的x为:',y)
z=np.float16(y)
print('True值转换为float16类型为:',z)
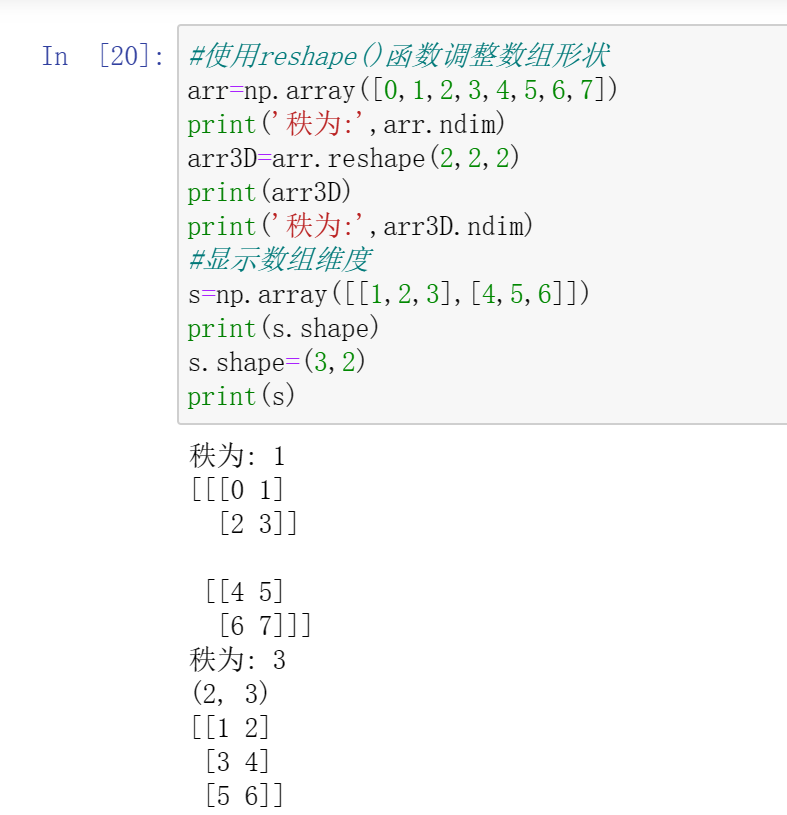
3、
#使用reshape()函数调整数组形状
arr=np.array([0,1,2,3,4,5,6,7])
print('秩为:',arr.ndim)
arr3D=arr.reshape(2,2,2)
print(arr3D)
print('秩为:',arr3D.ndim)
#显示数组维度
s=np.array([[1,2,3],[4,5,6]])
print(s.shape)
s.shape=(3,2)
print(s)
Pandas库练习
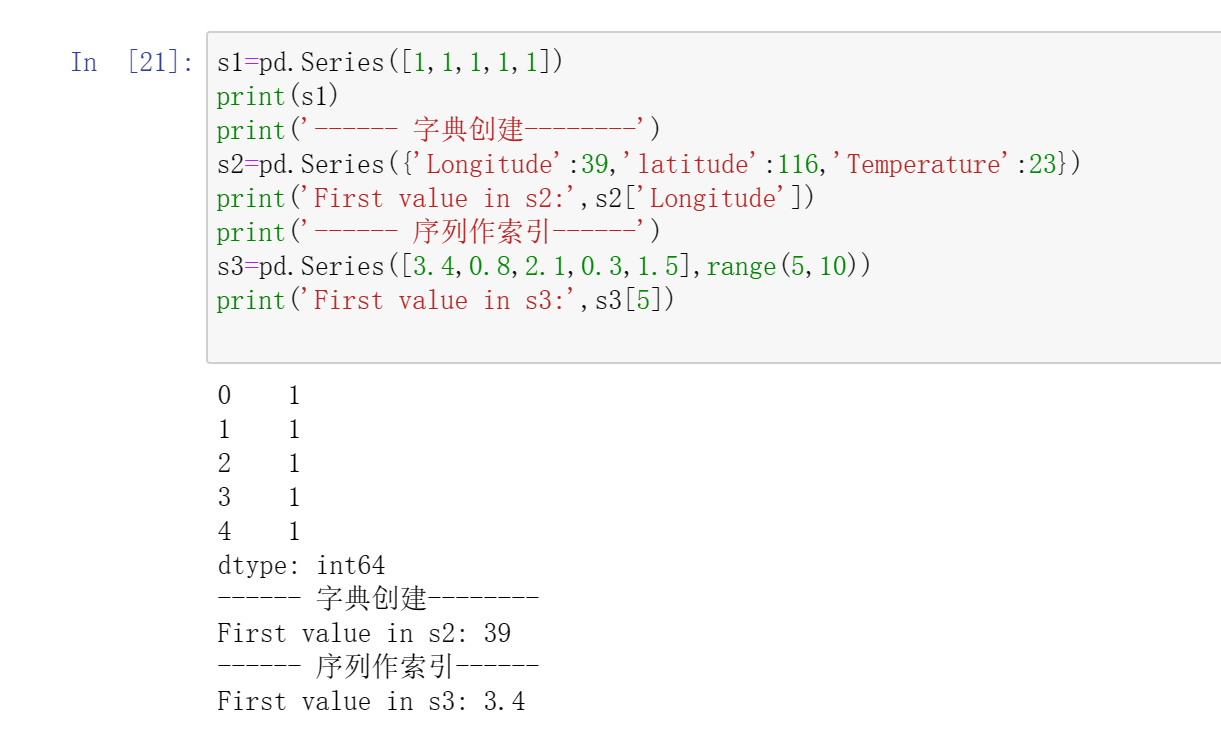
1、
s1=pd.Series([1,1,1,1,1])
print(s1)
print('------ 字典创建--------')
s2=pd.Series({'Longitude':39,'latitude':116,'Temperature':23})
print('First value in s2:',s2['Longitude'])
print('------ 序列作索引------')
s3=pd.Series([3.4,0.8,2.1,0.3,1.5],range(5,10))
print('First value in s3:',s3[5])
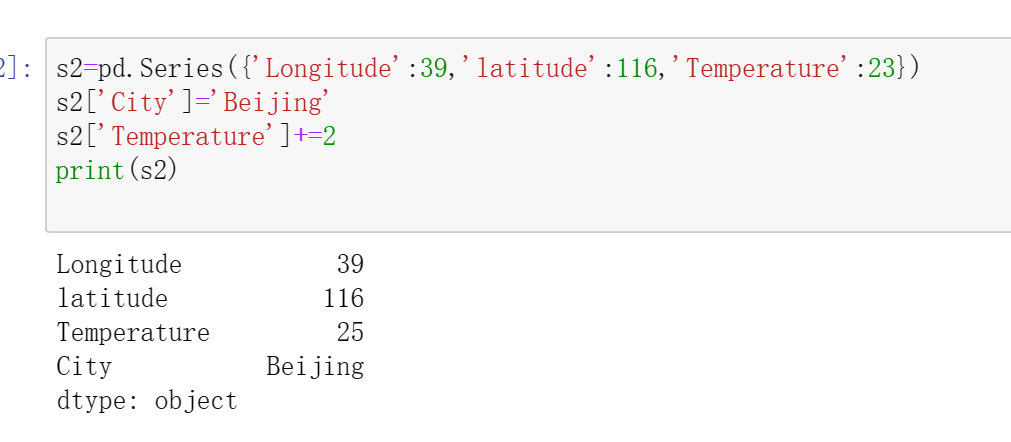
2、
s2=pd.Series({'Longitude':39,'latitude':116,'Temperature':23})
s2['City']='Beijing'
s2['Temperature']+=2
print(s2)
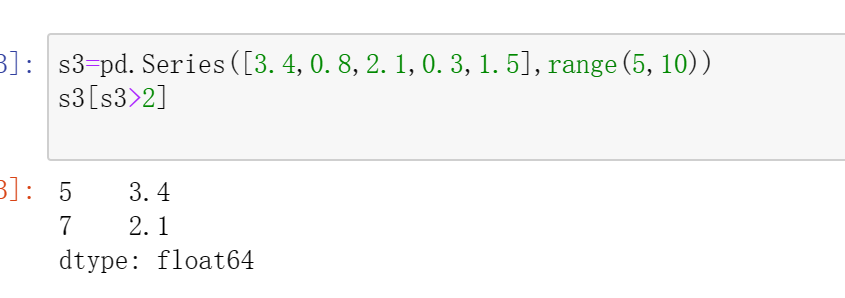
3、
s3=pd.Series([3.4,0.8,2.1,0.3,1.5],range(5,10))
s3[s3>2]
4、
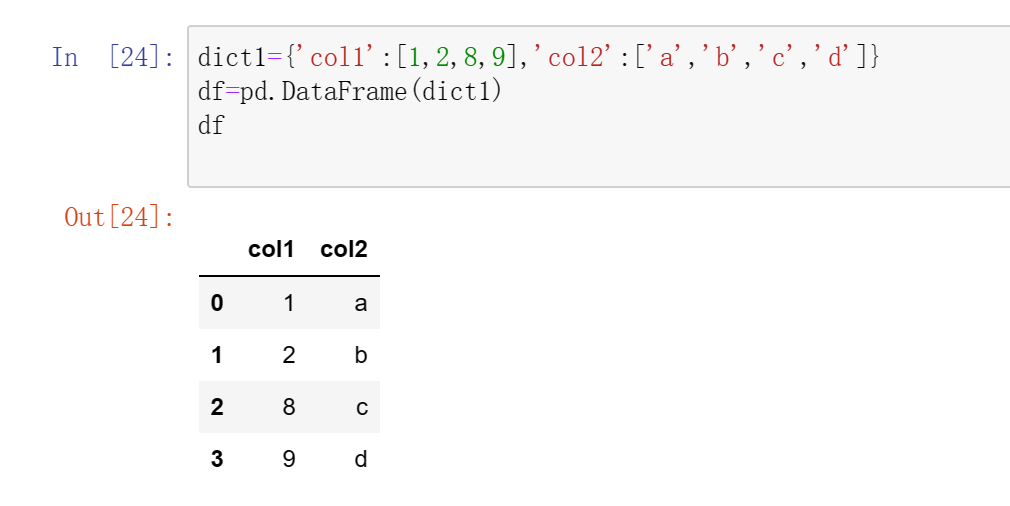
5、
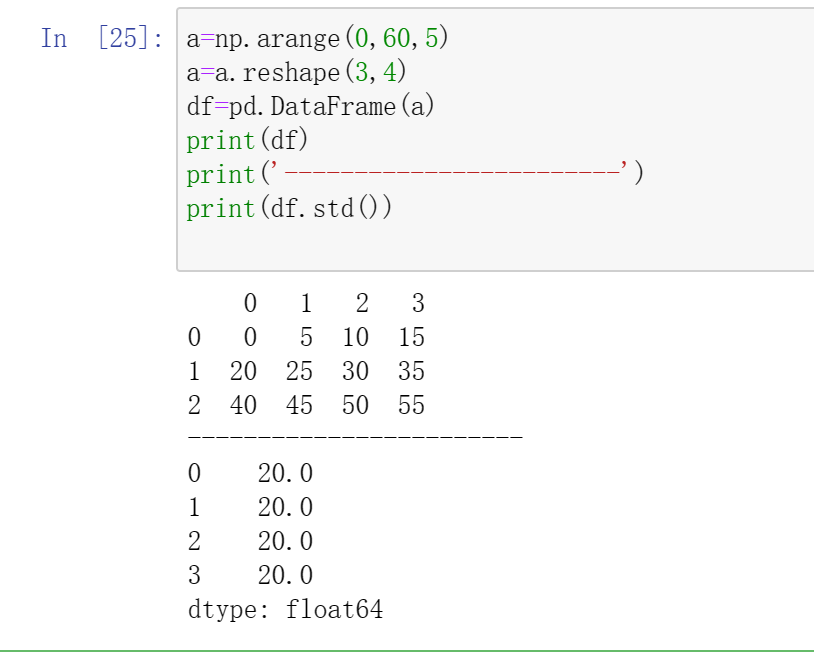
a=np.arange(0,60,5)
a=a.reshape(3,4)
df=pd.DataFrame(a)
print(df)
print('------------------------')
print(df.std())
Matplotlib练习
1、
fig=plt.figure()
ax1=fig.add_subplot(2,2,1)
ax1=fig.add_subplot(2,2,2)
ax2=fig.add_subplot(2,2,3)
fig.savefig('./kb.jpg')

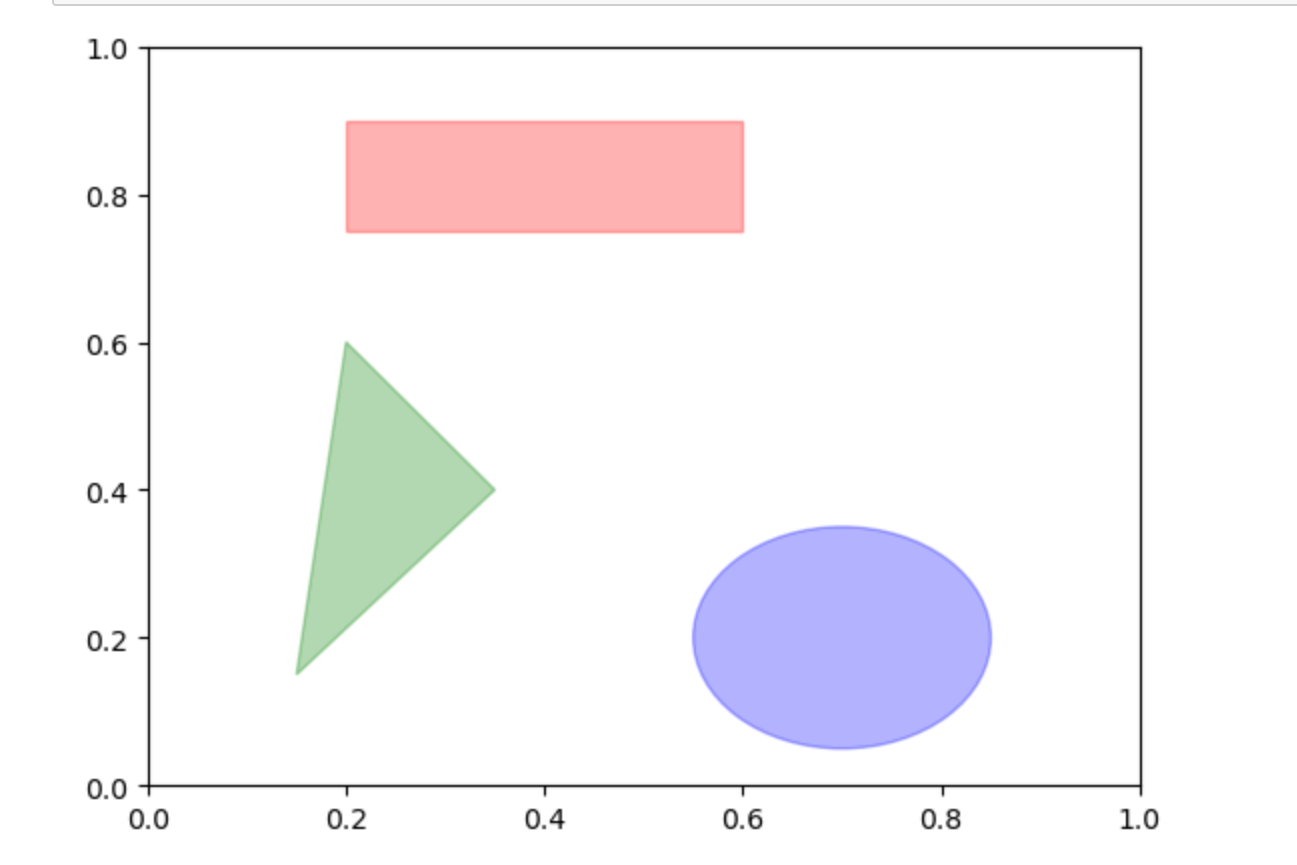
2、
fig=plt.figure()
ax=fig.add_subplot(1,1,1)
rect=plt.Rectangle((0.2,0.75),0.4,0.15,color='r',alpha=0.3)
circ=plt.Circle((0.7,0.2),0.15,color='b',alpha=0.3)
pgon=plt.Polygon([[0.15,0.15],[0.35,0.4],[0.2,0.6]],color='g',alpha=0.3)
ax.add_patch(rect)
ax.add_patch(circ)
ax.add_patch(pgon)
plt.show()
fig.savefig('./fang.jpg')
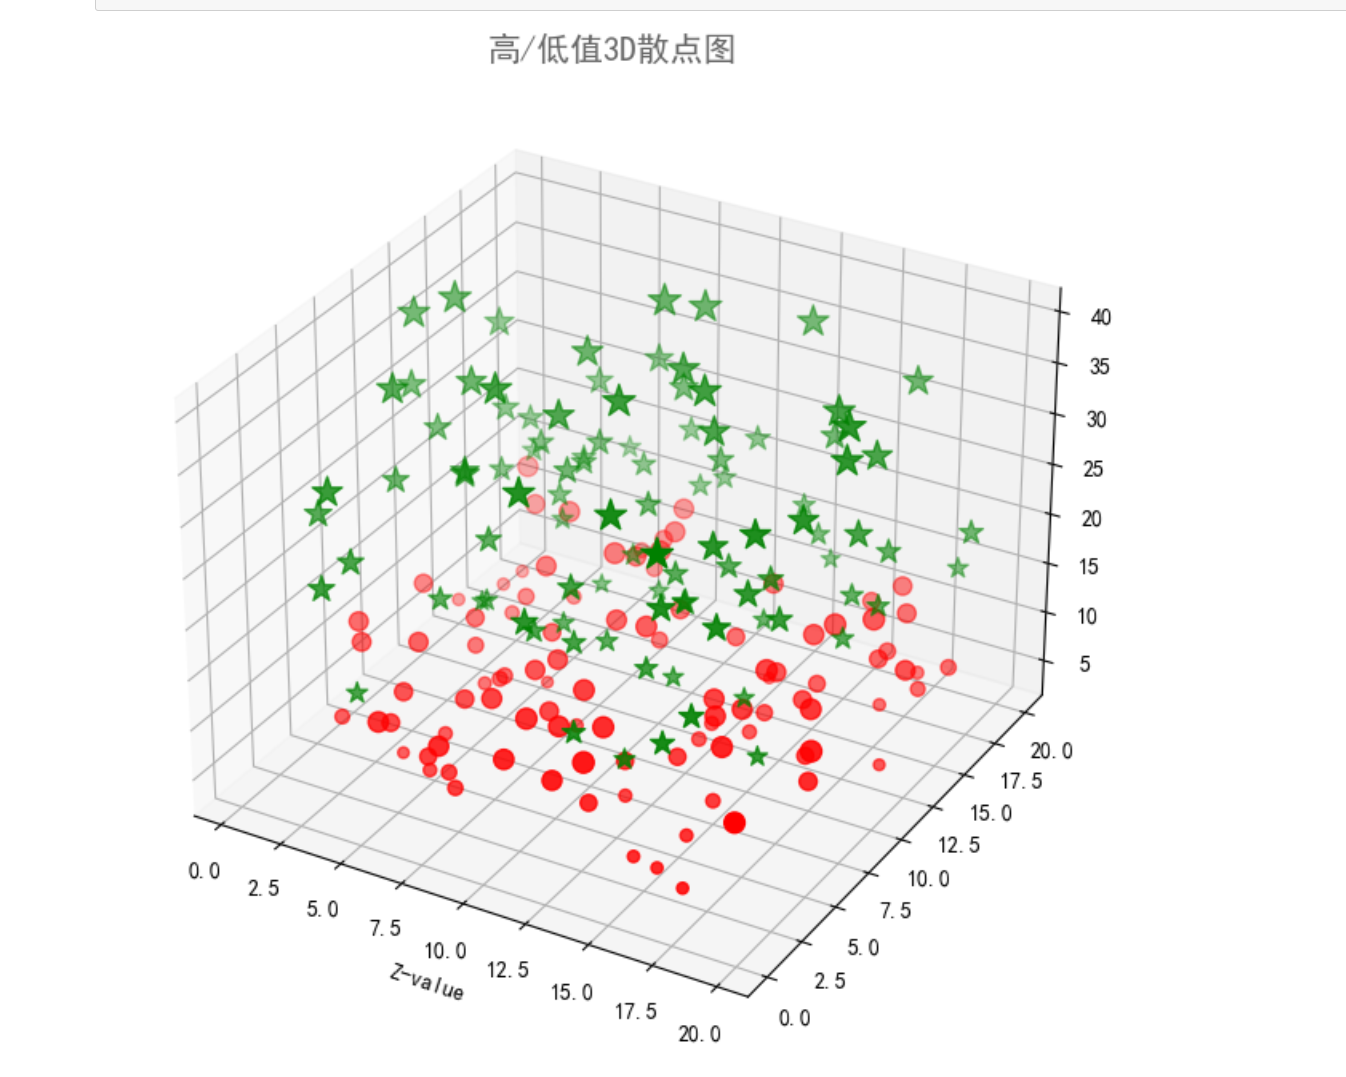
3、
def randrange(n, randFloor, randCeil):
    rnd=np.random.rand(n)
    return (randCeil-randFloor)*rnd + randFloor

plt.rcParams['font.sans-serif']=['SimHei']
fig = plt.figure(figsize=(10,8))
ax=fig.add_subplot(111,projection='3d')
n = 100
for zmin,zmax,c,m,l in [(4,15,'r','o','低值'),(13,40,'g','*','高值')]:
    x=randrange(n,0,20)
    y=randrange(n,0,20)
    z=randrange(n,zmin,zmax)
    ax.scatter(x,y,z,c=c,marker=m,label=l,s=z*6)
ax.set_xlabel('X-value')
ax.set_xlabel('Y-value')
ax.set_xlabel('Z-value')
ax.set_title("高/低值3D散点图",alpha=0.6,size=15,weight='bold')
plt.show()
fig.savefig('./散点图.jpg')
四、图灵测试
图灵测试最早出现在1950年图灵发表的一篇名为《计算机械和智能》(Computing Machinery and Intelligence)的论文中,是判断机器是否具有人工智能的一套方法。而图灵测试是人工智能最初的概念,它甚至早于“人工智能”这个词本身,人工智能一词是在1956年才被提出的。图灵测试的方法很简单,就是让测试者与被测试者(一个人和一台机器)隔开,通过一些装置(如键盘)向被测试者随意提问。进行多次测试后,如果有超过30%的测试者不能确定出被测试者是人还是机器,那么这台机器就通过了测试,并被认为具有人工智能。 它的发明者图灵被誉为计算机科学之父、人工智能之父。