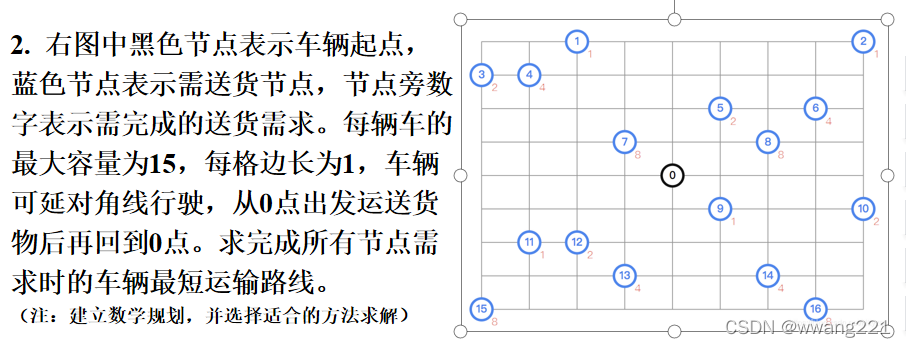
多vehicle的CVRP看作是one vehicle的CVRP,只是在vehicle自身负载的货物不够时,需要返回depot点
题目如下:
python代码
from sko.GA import GA_TSP
import matplotlib.pyplot as plt
import numpy as np
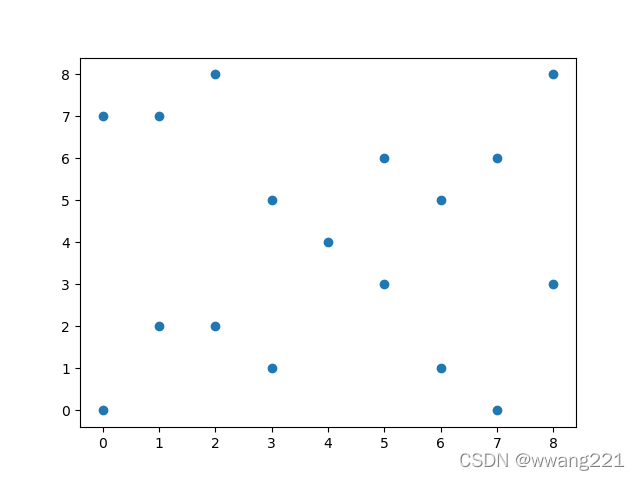
# 坐标分布情况,(4,4)为补货地点吗
points_coordinate = np.array([[4,4],[2,8],[8,8],[0,7],[1,7],[5,6],[7,6],[3,5],[6,5],[5,3],[8,3],[1,2],[2,2],[3,1],[6,1],[0,0],[7,0]] )
# 除初始点(4,4)以外,每个地点货物需求量
requirements = [1,1,2,4,2,4,8,8,1,2,1,2,4,4,8,8]
plt.scatter(*list(zip(*points_coordinate)))
plt.show()
# 可以将补货行为理解为多车辆单次VRP,总需求/最大载量,最小需要4次
num_vehicle = 4
max_capacity = 15
num_points = len(points_coordinate)
num_customers = num_points - 1
distance_matrix = np.linalg.norm(points_coordinate[:, None, :] - points_coordinate[None, :, :], axis=-1)

# 计算总行驶距离:初始点(4,4)到第1路径点+第1路径的到第n路径点再回到初始点
# routine中包含初始点,用于计算车辆回到初始点的距离
def obj_func(routine):
    num_points, = routine.shape
    return distance_matrix[0, routine[0]] \
        + sum([distance_matrix[routine[i % num_points], routine[(i + 1) % num_points]] for i in range(num_points)]) \
        + distance_matrix[routine[-1], 0]

# 增加约束,计算所有超出最大载量的累积数值,当作在计算个体fitness的时候的惩罚
def constraint_capacity(routine):
    capacity = 0
    c = 0
    for i in routine:
        if i != 0:
            c += requirements[i-1]
        else:
            capacity += max(0, c-max_capacity)
            c = 0
    capacity = max(c-max_capacity, capacity)
    return capacity

ga_tsp = GA_TSP(func=obj_func, n_dim=num_customers, size_pop=200, max_iter=200, prob_mut=1)

# 生产Chrom个体,每个个体代表一个routine
# np.zeros(shape=(ga_tsp.size_pop, num_vehicle-1):为3次回到初始点(首次出发不算在内)
# ga_tsp.Chrom + 1:为剔除初始点的points_coordinate中的index
ga_tsp.Chrom = np.concatenate([np.zeros(shape=(ga_tsp.size_pop, num_vehicle-1), dtype=int), ga_tsp.Chrom + 1],
    								  axis=1)
#添加约束
ga_tsp.has_constraint = True
ga_tsp.constraint_ueq = [constraint_capacity]
best_points, best_distance = ga_tsp.run()
print(best_distance)
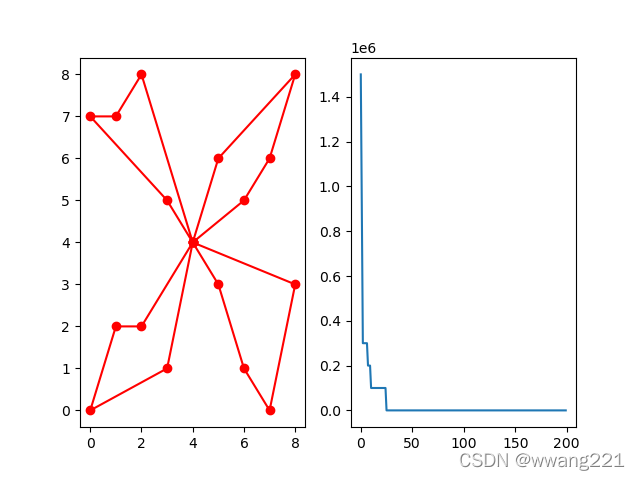
画图
fig, ax = plt.subplots(1, 2)
best_points_ = np.concatenate([[0], best_points, [0]])
best_points_coordinate = points_coordinate[best_points_, :]
ax[0].plot(best_points_coordinate[:, 0], best_points_coordinate[:, 1], 'o-r')
ax[1].plot(ga_tsp.generation_best_Y)
plt.show()
版权声明:本文为u011318721原创文章,遵循 CC 4.0 BY-SA 版权协议,转载请附上原文出处链接和本声明。