目录
7、jmap -dump:live,format=b,file=G:\heap.bin 6800
一、介绍
- jmap,Java Memory Map。主要用于打印指定Java进程(或核心文件、远程调试服务器)的共享对象内存映射或堆内存细节。
- jmap命令可以获得运行中的jvm的堆的快照,从而可以离线分析堆,以检查内存泄漏,检查一些严重影响性能的大对象的创建,检查系统中什么对象最多,各种对象所占内存的大小等等。可以使用jmap生成Heap Dump。
- 简单来说—>监控内存内的Java对象。
二、命令格式
- 语法:
jmap [option] <pid>- 说明:
1、pid:进程id
2、option:命令选项,常用选项如下:
where <option> is one of:
    <none>               to print same info as Solaris pmap
    -heap                to print java heap summary
    -histo[:live]        to print histogram of java object heap; if the "live"
                         suboption is specified, only count live objects
    -clstats             to print class loader statistics
    -finalizerinfo       to print information on objects awaiting finalization
    -dump:<dump-options> to dump java heap in hprof binary format
                         dump-options:
                           live         dump only live objects; if not specified,
                                        all objects in the heap are dumped.
                           format=b     binary format
                           file=<file>  dump heap to <file>
                         Example: jmap -dump:live,format=b,file=heap.bin <pid>
(1)
-heap
: 打印Java堆概要信息,包括使用的GC算法、堆配置参数和各代中堆内存使用情况;(2)
-histo
:打印Java堆中对象直方图,通过该图可以获取每个class的对象数目,占用内存大小和类全名信息;
-histo:live
:打印jvm heap的直方图,但是只统计存活对象的情况;(3)
-clstatst:
(1.8以后从-permsta改为-clstatst)打印 类加载器(永久代)统计信息;
(4)
-finalizerinfo
:
打印等待回收的对象信息;
(5)
-dump:<dump-options>
:以
hprof二进制格式
将Java堆信息
输出到文件
内,该文件可以用
MAT、VisualVM
或
jhat等工具查看
;
dump-options
选项
:
① live
只输出活着的对象
;
不指定,则输出堆中所有对象
② format=b
指定输出格式为二进制
③ file=<file>
指定文件名及文件存储位置,例如:
jmap -dump:live,format=b,file=
G
:\heap.bin <pid>
-F
与
-dump:<dump-options> <pid>
或
-histo<pid>
一起使用,当
<pid>
没有响应时,强制执行;注意:不支持
live子选项。
三、使用实例
步骤:
1、
运行
如下代码:
public class Test {

	public static void main(String[] args) {
		while(true) {
		}
	}
}
2、在cmd.exe中
执行jps命令获取进程id:
选择id=6800
C:\Users\Van>jps
10000
14224 Bootstrap
5904 Launcher
6800 Test
7104 Test
5044 Test
13736 Test
14808 Jps
10972
3、
执行jmap
pid
命令
。
1、jmap <none> pid
C:\Users\Van>jmap 6800
Attaching to process ID 6800, please wait...
Debugger attached successfully.
Client compiler detected.
JVM version is 25.131-b11
0x00cc0000      204K    G:\Program_files\Java\jdk1.8.0_131\bin\javaw.exe
0x548d0000      3896K   G:\Program_files\Java\jdk1.8.0_131\jre\bin\client\jvm.dll
0x5a880000      76K     G:\Program_files\Java\jdk1.8.0_131\jre\bin\zip.dll
0x5a8a0000      132K    G:\Program_files\Java\jdk1.8.0_131\jre\bin\java.dll
0x5a8d0000      48K     G:\Program_files\Java\jdk1.8.0_131\jre\bin\verify.dll
0x5a8e0000      32K     C:\Windows\SYSTEM32\WSOCK32.dll
0x5a8f0000      764K    G:\Program_files\Java\jdk1.8.0_131\jre\bin\msvcr100.dll
0x71e10000      2104K   C:\Windows\WinSxS\x86_microsoft.windows.common-controls_6595b64144ccf1df_6.0.15063.1058_none_887484c43e23e7c3\COMCTL32.dll
0x72c70000      140K    C:\Windows\SYSTEM32\WINMMBASE.dll
0x72dd0000      144K    C:\Windows\SYSTEM32\WINMM.dll
0x74110000      32K     C:\Windows\SYSTEM32\VERSION.dll
0x74260000      40K     C:\Windows\System32\CRYPTBASE.dll
0x74270000      128K    C:\Windows\System32\SspiCli.dll
0x743e0000      756K    C:\Windows\System32\msvcrt.dll
0x744a0000      768K    C:\Windows\System32\RPCRT4.dll
0x74560000      24K     C:\Windows\System32\PSAPI.DLL
0x74570000      484K    C:\Windows\System32\msvcp_win.dll
0x745f0000      2272K   C:\Windows\System32\combase.dll
0x74c50000      228K    C:\Windows\System32\cfgmgr32.dll
0x74ec0000      560K    C:\Windows\System32\shcore.dll
0x74f50000      476K    C:\Windows\System32\ADVAPI32.dll
0x74fd0000      1264K   C:\Windows\System32\USER32.dll
0x751a0000      19748K  C:\Windows\System32\SHELL32.dll
0x764f0000      1376K   C:\Windows\System32\gdi32full.dll
0x76650000      412K    C:\Windows\System32\WS2_32.dll
0x76830000      260K    C:\Windows\System32\sechost.dll
0x76940000      64K     C:\Windows\System32\profapi.dll
0x76950000      832K    C:\Windows\System32\KERNEL32.DLL
0x76a20000      1796K   C:\Windows\System32\KERNELBASE.dll
0x76d80000      148K    C:\Windows\System32\IMM32.DLL
0x76e90000      132K    C:\Windows\System32\GDI32.dll
0x76ec0000      56K     C:\Windows\System32\kernel.appcore.dll
0x76fd0000      348K    C:\Windows\System32\bcryptPrimitives.dll
0x77030000      88K     C:\Windows\System32\win32u.dll
0x77050000      5660K   C:\Windows\System32\windows.storage.dll
0x775e0000      276K    C:\Windows\System32\shlwapi.dll
0x77630000      276K    C:\Windows\System32\powrprof.dll
0x77680000      1120K   C:\Windows\System32\ucrtbase.dll
0x777a0000      1592K   C:\Windows\SYSTEM32\ntdll.dll
2、
jmap -heap 6800
C:\Users\Van>jmap -heap 6800
Attaching to process ID 6800, please wait...
Debugger attached successfully.
Client compiler detected.
JVM version is 25.131-b11

using thread-local object allocation.
Mark Sweep Compact GC

Heap Configuration:#堆内存初始化配置
   MinHeapFreeRatio         = 40  #-XX:MinHeapFreeRatio设置JVM堆最小空闲比率
   MaxHeapFreeRatio         = 70  #-XX:MaxHeapFreeRatio设置JVM堆最大空闲比率
   MaxHeapSize              = 268435456 (256.0MB) #-XX:MaxHeapSize=设置JVM堆的最大大小
   NewSize                  = 5570560 (5.3125MB)  #-XX:NewSize=设置JVM堆的‘新生代’的默认大小
   MaxNewSize               = 89456640 (85.3125MB) #-XX:MaxNewSize=设置JVM堆的‘新生代’的最大大小

   OldSize                  = 11206656 (10.6875MB) #-XX:OldSize=设置JVM堆的‘老生代’的大小
   NewRatio                 = 2 #-XX:NewRatio=:‘新生代’和‘老生代’的大小比率
   SurvivorRatio            = 8 #-XX:SurvivorRatio=设置年轻代中Eden区与Survivor区的大小比值
   MetaspaceSize            = 12582912 (12.0MB) # metaspace,元数据空间,专门用来存元数据的,它是jdk8里特有的数据结构用来替代perm(永久代)
   CompressedClassSpaceSize = 1073741824 (1024.0MB) #-XX:CompressedClassSpaceSize=设置Klass Metaspace的大小,
   MaxMetaspaceSize         = 4294901760 (4095.9375MB) #用于设置metaspace区域的最大值,这个值可以通过mxbean中的MemoryPoolBean获取到,如果这个参数没有设置,那么就是通过mxbean拿到的最大值是-1,表示无穷大。
   G1HeapRegionSize         = 0 (0.0MB) #-XX:G1HeapRegionSize=n,使用G1时Java堆会被分为大小统一的的区(region)。此参数可以指定每个heap区的大小. 默认值将根据 heap size 算出最优解. 最小值为 1Mb, 最大值为 32Mb.

Heap Usage:
New Generation (Eden + 1 Survivor Space): #新生代区内存分布,包含伊甸园区+1个Survivor区
   capacity = 5046272 (4.8125MB)
   used     = 1044400 (0.9960174560546875MB)
   free     = 4001872 (3.8164825439453125MB)
   20.696466619318183% used
Eden Space: #Eden区内存分布
   capacity = 4521984 (4.3125MB)
   used     = 1044400 (0.9960174560546875MB)
   free     = 3477584 (3.3164825439453125MB)
   23.096056951992754% used
From Space: #其中一个Survivor区的内存分布
   capacity = 524288 (0.5MB)
   used     = 0 (0.0MB)
   free     = 524288 (0.5MB)
   0.0% used
To Space: #另一个Survivor区的内存分布
   capacity = 524288 (0.5MB)
   used     = 0 (0.0MB)
   free     = 524288 (0.5MB)
   0.0% used
tenured generation: #当前的Old区内存分布
   capacity = 11206656 (10.6875MB)
   used     = 0 (0.0MB)
   free     = 11206656 (10.6875MB)
   0.0% used

1621 interned Strings occupying 129144 bytes.
3、
jmap -histo 6800
C:\Users\Van>jmap -histo 6800

 num     #instances         #bytes  class name
----------------------------------------------
   1:          3701         499368  [C
   2:           467         229680  [I
   3:           192          77200  [B
   4:           512          50096  java.lang.Class
   5:          2643          42288  java.lang.String
   6:           588          32184  [Ljava.lang.Object;
   7:           835          26720  java.util.TreeMap$Entry
   8:           214           7736  [Ljava.lang.String;
   9:           115           7360  java.lang.reflect.Field
  10:            65           4160  java.net.URL
  11:           258           4128  java.lang.Integer
  12:           226           3616  java.lang.StringBuilder

...
Total         11563        1044400
class name列出现了[C、[B、[L等很奇怪的内容,这些属于
非自定义类
,具体为:
BaseType Character
Type
Interpretation
B
byte
signed byte
C
char
Unicode character
D
double
double-precision floating-point value
F
float
single-precision floating-point value
I
int
integer
J
long
long integer
L;
reference
an instance of class
S
short
signed short
Z
boolean
true or false
[
reference
one array dimension
4、
jmap -histo:live 6800
C:\Users\Van>jmap -histo:live 6800

 num     #instances         #bytes  class name
----------------------------------------------
   1:          2253         292624  [C
   2:           512          50096  java.lang.Class
   3:            17          34208  [B
   4:          2111          33776  java.lang.String
   5:           557          30240  [Ljava.lang.Object;
   6:           835          26720  java.util.TreeMap$Entry
   7:           195           7280  [Ljava.lang.String;
   8:            79           5056  java.lang.reflect.Field
   9:           256           4096  java.lang.Integer
  10:            61           3904  java.net.URL
  11:            93           3616  [I
  12:            95           3040  java.lang.ref.SoftReference

...
Total          8159         535392
5、
jmap -clstats 6800
C:\Users\Van>jmap -clstats 6800
Attaching to process ID 6800, please wait...
Debugger attached successfully.
Client compiler detected.
JVM version is 25.131-b11
finding class loader instances ..done.
computing per loader stat ..done.
please wait.. computing liveness................................................................done.
class_loader    classes bytes   parent_loader   alive?  type

<bootstrap>     441     690035    null          live    <internal>
0x09dba908      0       0         null          live    sun/misc/Launcher$ExtClassLoader@0x15498f70
0x09dc09a8      7       17424   0x09dba908      live    sun/misc/Launcher$AppClassLoader@0x15498780

total = 3       448     707459      N/A         alive=3, dead=0     N/A
6、
jmap -finalizerinfo 6800
C:\Users\Van>jmap -finalizerinfo 6800
Attaching to process ID 6800, please wait...
Debugger attached successfully.
Client compiler detected.
JVM version is 25.131-b11
Number of objects pending for finalization: 0
7、
jmap -dump:live,format=b,file=G:\heap.bin 6800
C:\Users\Van>jmap -dump:live,format=b,file=G:\heap.bin 6800

Dumping heap to G:\heap.bin ...

Heap dump file created
此文件可以用jhat来解析:
j
hat
用于分析产生的堆文件,可以将堆中的对象以
html的形式显示出来,包括对象的数量,大小等等,并支持对象查询语言。
步骤:
1、如上述所示
导出堆文件;
2、分析堆文件
:
jhat -J-Xmx512m <heap dump file>
解析
Java堆转储文件
,
并启动一个 web server
;
说明:有时
dump出来的堆
文件
很大,在启动时报堆空间不足的错误
,
可
添加
-J-Xmx512M参数
;
C:\Users\Van> jhat -J-Xmx512m G:\heap.bin
Reading from G:\heap.bin...
Dump file created Sun Jul 21 17:42:16 CST 2019
Snapshot read, resolving...
Resolving 7939 objects...
Chasing references, expect 1 dots.
Eliminating duplicate references.
Snapshot resolved.
Started HTTP server on port 7000
Server is ready.
3
、
查看
html
:
在浏览器中输入主机地址:
端口号
:
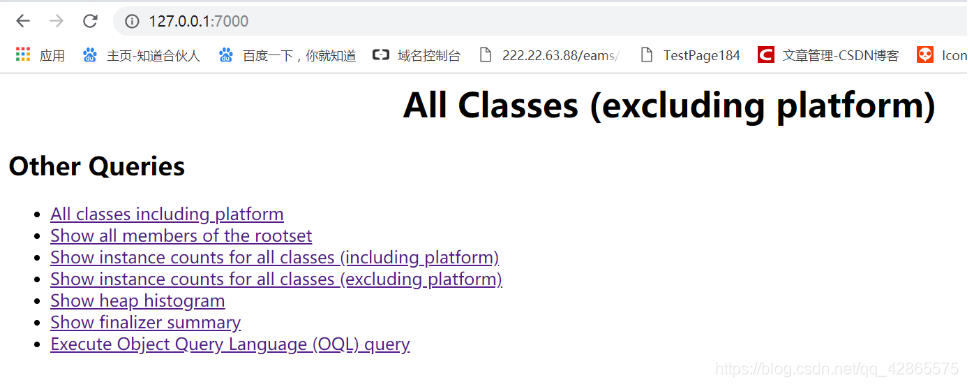
说明:
All classes including platform 显示所有创建堆中对象的类
Show all members of the rootset 显示rootset能引用到的所有对象
Show instance counts for all classes (including platform) 显示所有类(包括JDK中定义的Java类)的实例数量
Show instance counts for all classes (excluding platform)
显示所有类(不包括JDK中定义的Java类)的实例数量
Show heap histogram
显示堆内对象直方图
Show finalizer summary 显示等待回收的对象信息
Execute Object Query Language (OQL) query 执行对象查询语句