【0】核心表
sys.`innodb_lock_waits`
performance_schema.events_statements_history
performance_schema.data_locks
performance_schema.data_locks_wait
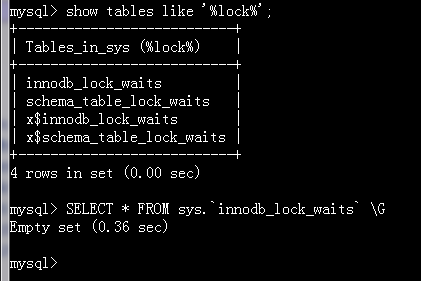
【1】查看锁信息
performance_schema.data_locks
performance_schema.data_locks_wait
线上mysql版本为8.0.11,对于最近的几个版本越来越像Orale了,有了较为丰富的系统字典,也可以查看系统的等待事件,现在线上出现被锁语句的情况也可以通过数据字典直接查询出来了,在此记录下以供参考。
首先查看系统锁情况,下面这条语句可以看到持有锁的线程以及线程ID,这里需要注意下,session_id也就是show processlist查询出来的链接ID,在这个表里表现为PID,同时该表也记录了trx_id,最后还给出了解决方案也就是如何kill持有锁的进程。
mysql> SELECT * FROMsys.`innodb_lock_waits` \G*************************** 1. row ***************************wait_started:2019-01-28 14:27:03wait_age:00:00:03wait_age_secs:3locked_table: `test`.`t`
locked_table_schema: test
locked_table_name: t
locked_table_partition:NULLlocked_table_subpartition:NULLlocked_index: GEN_CLUST_INDEX
locked_type: RECORD
waiting_trx_id:19758723waiting_trx_started:2019-01-28 14:27:03waiting_trx_age:00:00:03waiting_trx_rows_locked:1waiting_trx_rows_modified:0waiting_pid:4202waiting_query:update t set id=8waiting_lock_id:19758723:4998:4:2waiting_lock_mode: X
blocking_trx_id:19748728blocking_pid:4200blocking_query:NULLblocking_lock_id:19748728:4998:4:2blocking_lock_mode: X
blocking_trx_started:2019-01-28 10:58:27blocking_trx_age:03:28:39blocking_trx_rows_locked:2blocking_trx_rows_modified:1sql_kill_blocking_query:KILL QUERY 4200sql_kill_blocking_connection:KILL 4200
1 row in set (0.02 sec
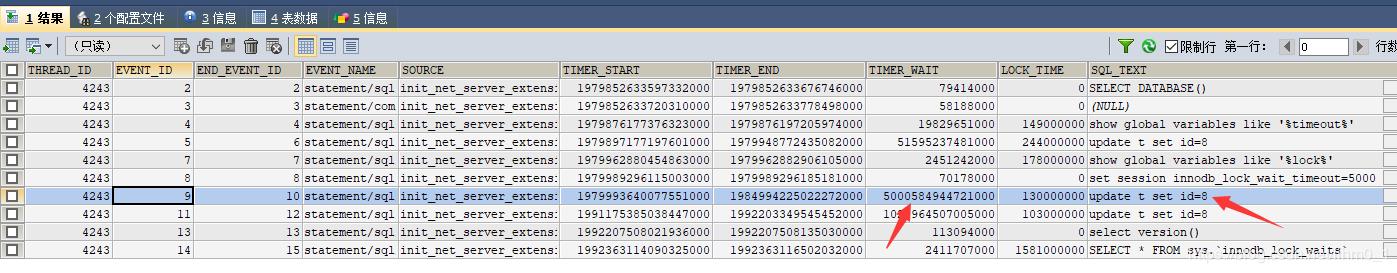
【2】查看当前被锁的语句
##等待锁的语句SELECT * FROM performance_schema.events_statements_history WHERE thread_id IN(SELECT b.`THREAD_ID` FROM sys.`innodb_lock_waits` AS a , performance_schema.threads ASbWHERE a.waiting_pid =b.`PROCESSLIST_ID`)ORDER BY timer_start ASC;
【3】看持有锁的语句
可以通过如下方式
##持有锁的语句SELECT * FROM performance_schema.events_statements_history WHERE thread_id IN(SELECT b.`THREAD_ID` FROM sys.`innodb_lock_waits` AS a , performance_schema.threads ASbWHERE a.`blocking_pid` =b.`PROCESSLIST_ID`)ORDER BY timer_start ASC;
