概述
ImageMosaic
翻译成中文就是影像拼接,适用于多个影像文件需要在一起展示的场景,针对这种场景,我们可以对每一个影像数据发布服务,完了通过
layergroup
的方式统一成一个服务,很显然,如果当影像很多的时候这种操作既耗时又费力,这个时候你就需要用到geoserver的
ImageMosaic
,它可以实现将一个文件夹下面的所有影像文件发布成一个服务的需求。
效果
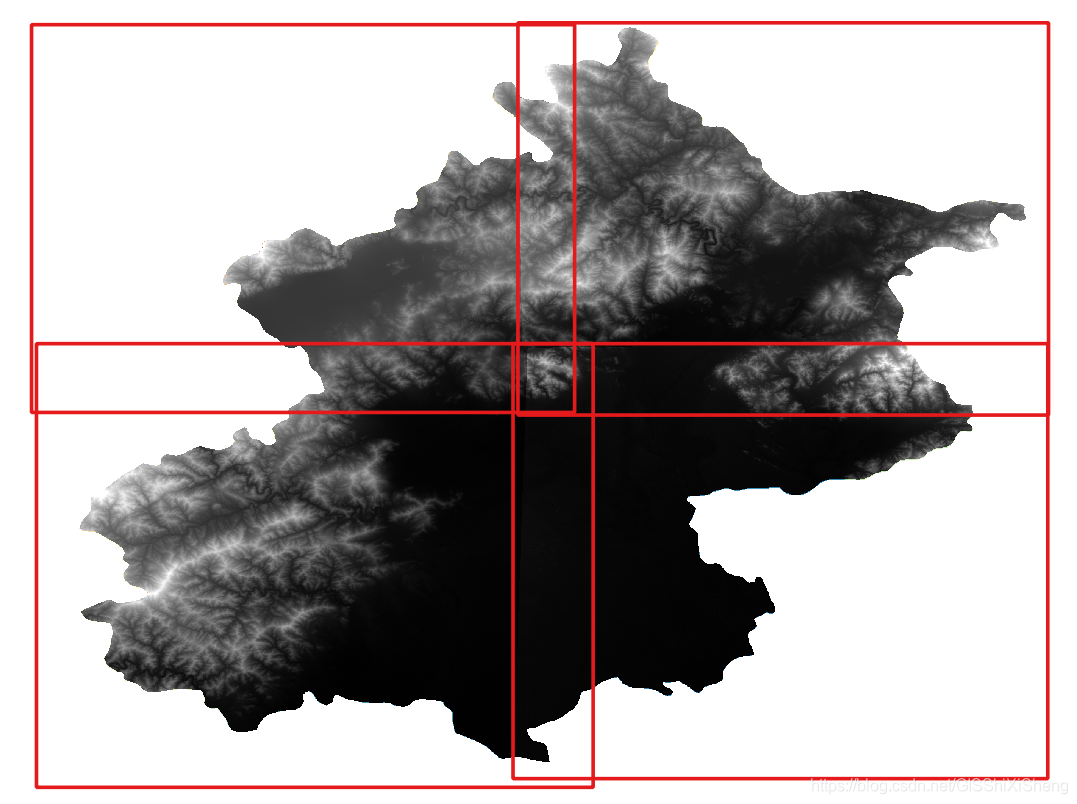
本文所用的测试数据是北京30m分辨率的dem数据,为方便测试按照下图切割成了四份,为防止中间会存在数据的丢失,在边缘区域将范围扩大了一点。
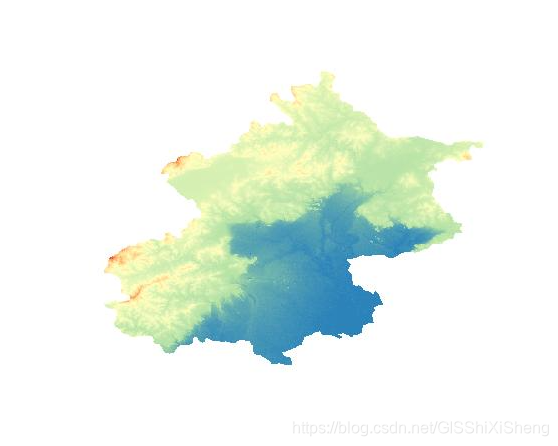
在geoserver发布后的效果如下。
实现
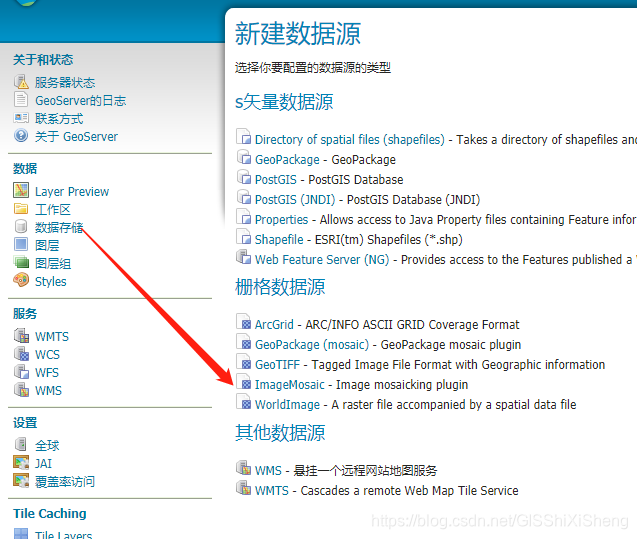
1、添加
ImageMosaic
数据源
ImageMosaic
-
数据存储—>新建数据源—>
ImageMosaic
输入相关信息,选择影响存储目录。
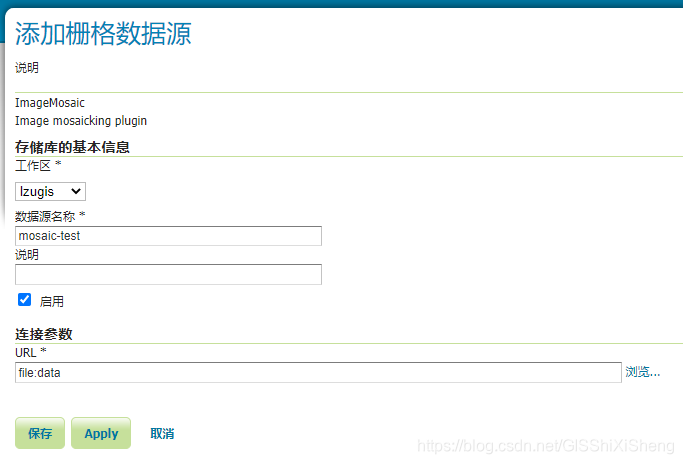
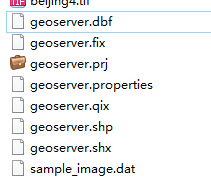
点击保存之后,geoserver会自动在目录下根据数据生成一个shp文件,shp的文件名称是文件目录的名称。
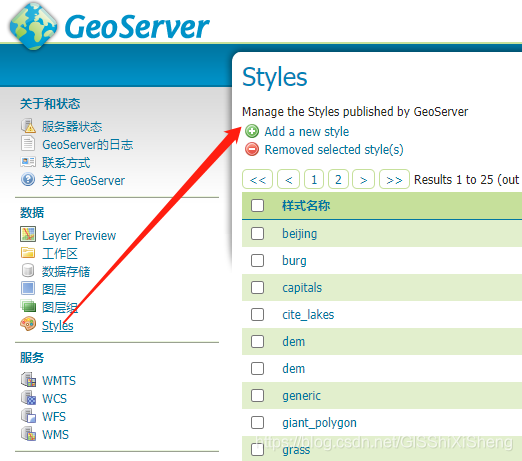
2、添加样式
为了让发布出来的样式好看一点,我们需要配置一下样式。样式可以在qgis中配置好后导出成sld文件。
-
Styles—>Add a new style
示例中,
sld
的内容如下:
<?xml version="1.0" encoding="UTF-8"?>
<StyledLayerDescriptor xmlns="http://www.opengis.net/sld" xmlns:gml="http://www.opengis.net/gml" xmlns:sld="http://www.opengis.net/sld" version="1.0.0" xmlns:ogc="http://www.opengis.net/ogc">
  <UserLayer>
    <sld:LayerFeatureConstraints>
      <sld:FeatureTypeConstraint/>
    </sld:LayerFeatureConstraints>
    <sld:UserStyle>
      <sld:Name>beijing</sld:Name>
      <sld:FeatureTypeStyle>
        <sld:Rule>
          <sld:RasterSymbolizer>
            <sld:ChannelSelection>
              <sld:GrayChannel>
                <sld:SourceChannelName>1</sld:SourceChannelName>
              </sld:GrayChannel>
            </sld:ChannelSelection>
            <sld:ColorMap type="ramp">
              <sld:ColorMapEntry quantity="20" label="<20" color="#2b83ba"/>
              <sld:ColorMapEntry quantity="40" label="20-40" color="#4f9db4"/>
              <sld:ColorMapEntry quantity="60" label="40-60" color="#74b7ae"/>
              <sld:ColorMapEntry quantity="80" label="60-80" color="#99d0a7"/>
              <sld:ColorMapEntry quantity="100" label="80-100" color="#b7e2a8"/>
              <sld:ColorMapEntry quantity="400" label="100-400" color="#cfecb0"/>
              <sld:ColorMapEntry quantity="700" label="400-700" color="#e7f6b8"/>
              <sld:ColorMapEntry quantity="1000" label="700-1000" color="#ffffbf"/>
              <sld:ColorMapEntry quantity="1300" label="1000-1300" color="#ffe8a4"/>
              <sld:ColorMapEntry quantity="1600" label="1300-1600" color="#fed189"/>
              <sld:ColorMapEntry quantity="1900" label="1600-1900" color="#f89957"/>
              <sld:ColorMapEntry quantity="2000" label="1900-2000" color="#feba6e"/>
              <sld:ColorMapEntry quantity="2100" label="2000-2100" color="#ed6e43"/>
              <sld:ColorMapEntry quantity="2200" label="2100-2200" color="#e2432f"/>
              <sld:ColorMapEntry quantity="2300" label=">2200" color="#d7191c"/>
            </sld:ColorMap>
          </sld:RasterSymbolizer>
        </sld:Rule>
      </sld:FeatureTypeStyle>
    </sld:UserStyle>
  </UserLayer>
</StyledLayerDescriptor>
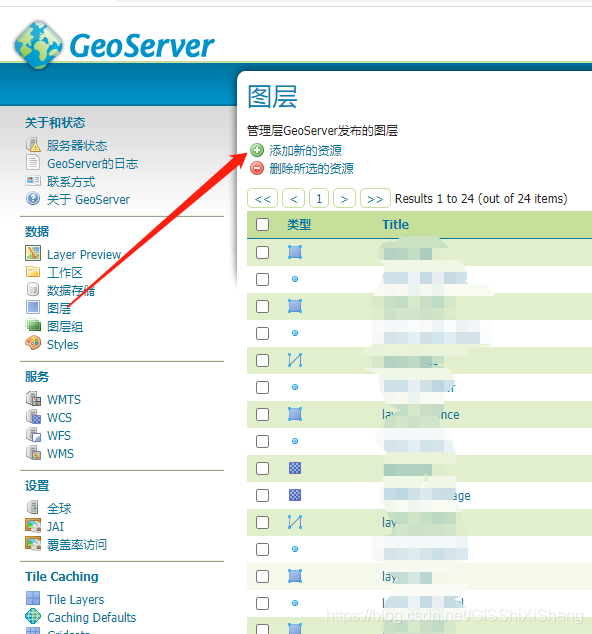
3、发布服务
-
图层—>添加新的资源
版权声明:本文为GISShiXiSheng原创文章,遵循 CC 4.0 BY-SA 版权协议,转载请附上原文出处链接和本声明。