文章目录
欢迎关注公众号【Python开发实战】, 获取更多内容!
工具-pandas
pandas库提供了高性能、易于使用的数据结构和数据分析工具。其主要数据结构是DataFrame,可以将DataFrame看做内存中的二维表格,如带有列名和行标签的电子表格。许多在Excel中可用的功能都可以通过编程实现,例如创建数据透视表、基于其他列计算新列的值、绘制图形等。还可以按照列的值对行进行分组,或者像SQL中那样连接表格。pandas也擅长处理时间序列。
但是介绍pandas之前,需要有numpy的基础,如果还不熟悉numpy,可以查看
numpy快速入门教程
。
导入pandas
import pandas as pd
Dataframe对象
一个DataFrame对象表示一个电子表格,带有单元格值、列名和行索引标签。可以定义表达式基于其他列计算列的值、创建数据透视表、按行分组、绘制图形等。可以将DataFrame视为Series的字典。
转置
d1 = pd.DataFrame(
    {
        ('public', 'birthyear'): {('Paris', 'alice'):1985, ('Paris', 'bob'):1984, ('London', 'charles'): 1992},
        ('public', 'hobby'): {('Paris', 'alice'):'Biking', ('Paris', 'bob'):'Dancing'},
        ('private', 'weight'): {('Paris', 'alice'):68, ('Paris', 'bob'):83, ('London', 'charles'): 112},
        ('private', 'children'): {('Paris', 'alice'):np.nan, ('Paris', 'bob'):3, ('London', 'charles'): 0},
    }
)
d1
输出:

可以使用属性
T
交换行索引和列索引。
d2 = d1.T
d2
输出:

计算表达式
pandas支持的一个重要特性是表达式的计算,这需要依赖于numexpr,即必须安装安库才能使用该特性。
people_dict = {
    'weight': pd.Series([68, 83, 112], index=['alice', 'bob', 'charles']),
    'birthyear': pd.Series([1984, 1985, 1992], index=['bob', 'alice', 'charles'], name='year'),
    'children': pd.Series([0, 3], index=['charles', 'bob']),
    'hobby': pd.Series(['Biking', 'Dancing'], index=['alice', 'bob']),
}
people = pd.DataFrame(people_dict)
people
输出:

people.eval('weight / (height / 100) ** 2 > 25')
输出:
alice      False
bob         True
charles     True
dtype: bool
还支持赋值表达式,将inplace参数设置为True就可以直接修改DataFrame,而不是得到一个修改的副本。
people.eval('body_mass_index = weight / (height / 100) ** 2 ', inplace=True)
people
输出:

表达式中可以使用局部变量或全局变量,方法是在变量前面加符号
@
。
overweight_threshold = 30
people.eval('overweight = body_mass_index > @overweight_threshold', inplace=True)
people
输出:

DataFrame查询
query方法可以根据查询表达式从DataFrame中筛选数据。
people.query('age > 30 and pets == 0')
输出:

DataFrame排序
通过嗲用sort_index方法可以对DataFrame进行排序。默认情况下,是按照行索引标签升序对行进行排序,但是也可以翻转顺序。
people.sort_index(ascending=False)
输出:

请注意,sort_index方法返回的是一个排序后的副本。要是想直接修改,同样的设置inplace参数为True。此外,可以设置参数axis=1来对列排序而不是对行排序。
people.sort_index(axis=1, inplace=True)
people
输出:

可以值排序DataFrame,而不是按行索引或列索引,调用sort_values方法,并指定要排序的列。
people.sort_values(by='age', inplace=True)
people
输出:

绘制DataFrame
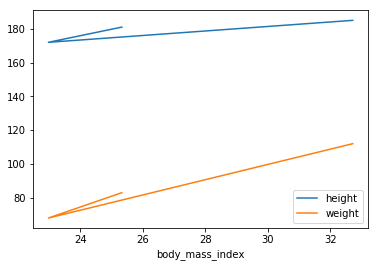
和Series相似,基于DataFrame,使用pandas绘制漂亮的图形很容易。例如,通过调用DataFrame的plot方法,绘制折线图是很容易的。
import matplotlib.pyplot as plt
people.plot(x='body_mass_index', y=['height', 'weight'], kind='line')
plt.show()

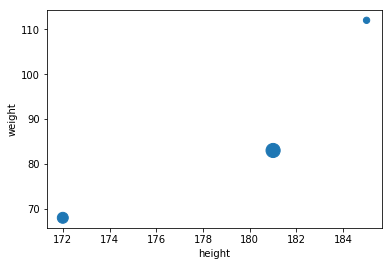
可以传递matplotlib函数支持的额外参数。例如,创建一个散点图,并使用matplotlib的scatter()函数中s参数,传递设置点大小的列表。
people.plot(x='height', y='weight', kind='scatter', s=[40, 120, 200])
plt.show()
