目录
一、快速上手
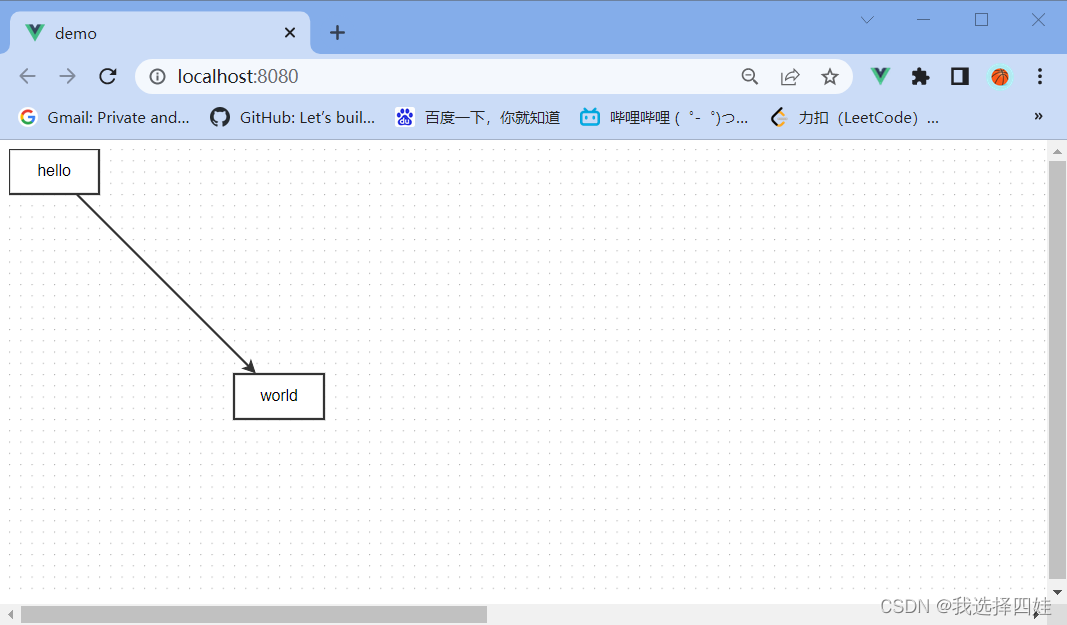
(1)HelloWorld
- HelloWorld.vue
<template>
  <div id="container"></div>
</template>

<script>
import {Graph} from '@antv/x6'
import {onMounted} from "vue";

const data = {
  nodes: [
    {
      id: 'node1',
      x: 0,
      y: 0,
      width: 80,
      height: 40,
      label: 'hello'
    },
    {
      id: 'node2',
      x: 200,
      y: 200,
      width: 80,
      height: 40,
      label: 'world'
    }
  ],
  edges: [
    {
      source: 'node1',
      target: 'node2',
    }
  ]
}

export default {
  name: 'HelloWorld',
  setup() {
    let graph = {}
    onMounted(() => {
      graph = new Graph({
        container: document.getElementById('container'),
        width: 2000,
        height: 400,
        grid: true,
      })
      graph.fromJSON(data);
    })
  }
}
</script>

<style scoped>
</style>
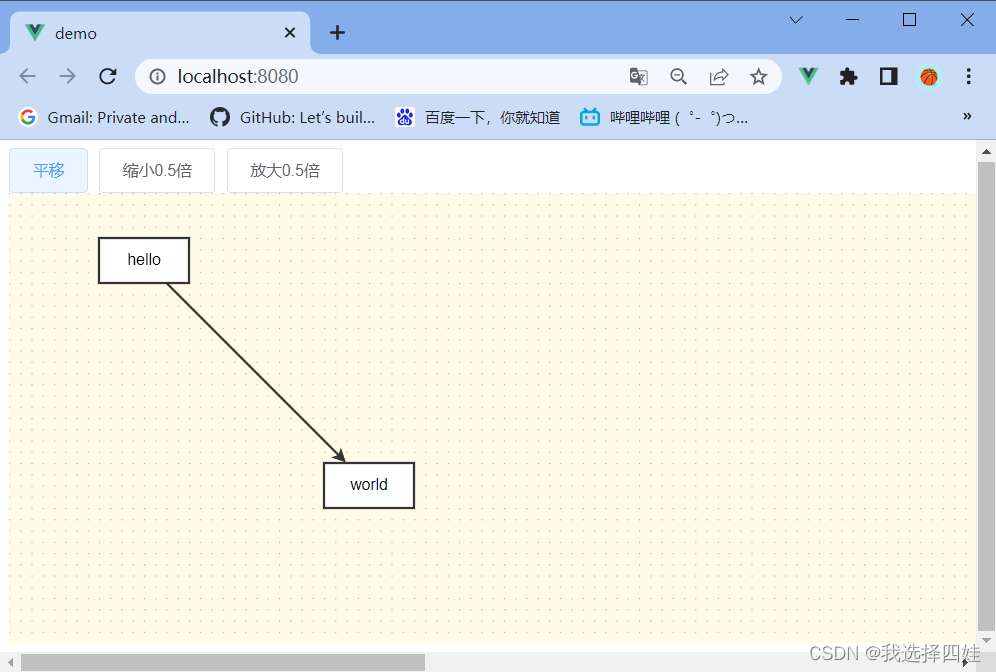
(2)demo2:平移、放大与缩小
- demo2.vue
<template>
  <div>
    <!-- element-ui组件,需要在main.js中引入,方法见chapter 2-4 -->
    <el-button @click="pingyi">平移</el-button>
    <el-button @click="suoxiao">缩小0.5倍</el-button>
    <el-button @click="fangda">放大0.5倍</el-button>
    <div id="container"></div>
  </div>
</template>

<script>
import {Graph} from '@antv/x6'
import {onMounted} from "vue";

const data = {
  nodes: [
    {
      id: 'node1',
      x: 0,
      y: 0,
      width: 80,
      height: 40,
      label: 'hello'
    },
    {
      id: 'node2',
      x: 200,
      y: 200,
      width: 80,
      height: 40,
      label: 'world'
    }
  ],
  edges: [
    {
      source: 'node1',
      target: 'node2',
    }
  ]
}

export default {
  name: 'demo2',
  setup() {
    let graph = {}
    onMounted(() => {
      graph = new Graph({
        container: document.getElementById('container'),
        width: 2000,
        height: 400,
        grid: {
          // 默认是10px
          size: 10,
          visible: true,
        },
        background: {
          color: '#fffbe6',
        }
      })
      graph.fromJSON(data);
    });

    // 定义平移方法
    const pingyi = ()=>{
      graph.translate(80, 40)
    }

    // 定义缩小方法
    const suoxiao = ()=>{
      graph.zoom(-0.5)
    }

    // 定义放大方法
    const fangda = ()=>{
      graph.zoom(0.5)
    }

    return {
      pingyi,
      suoxiao,
      fangda
    }
  }

}
</script>

<style scoped>
</style>
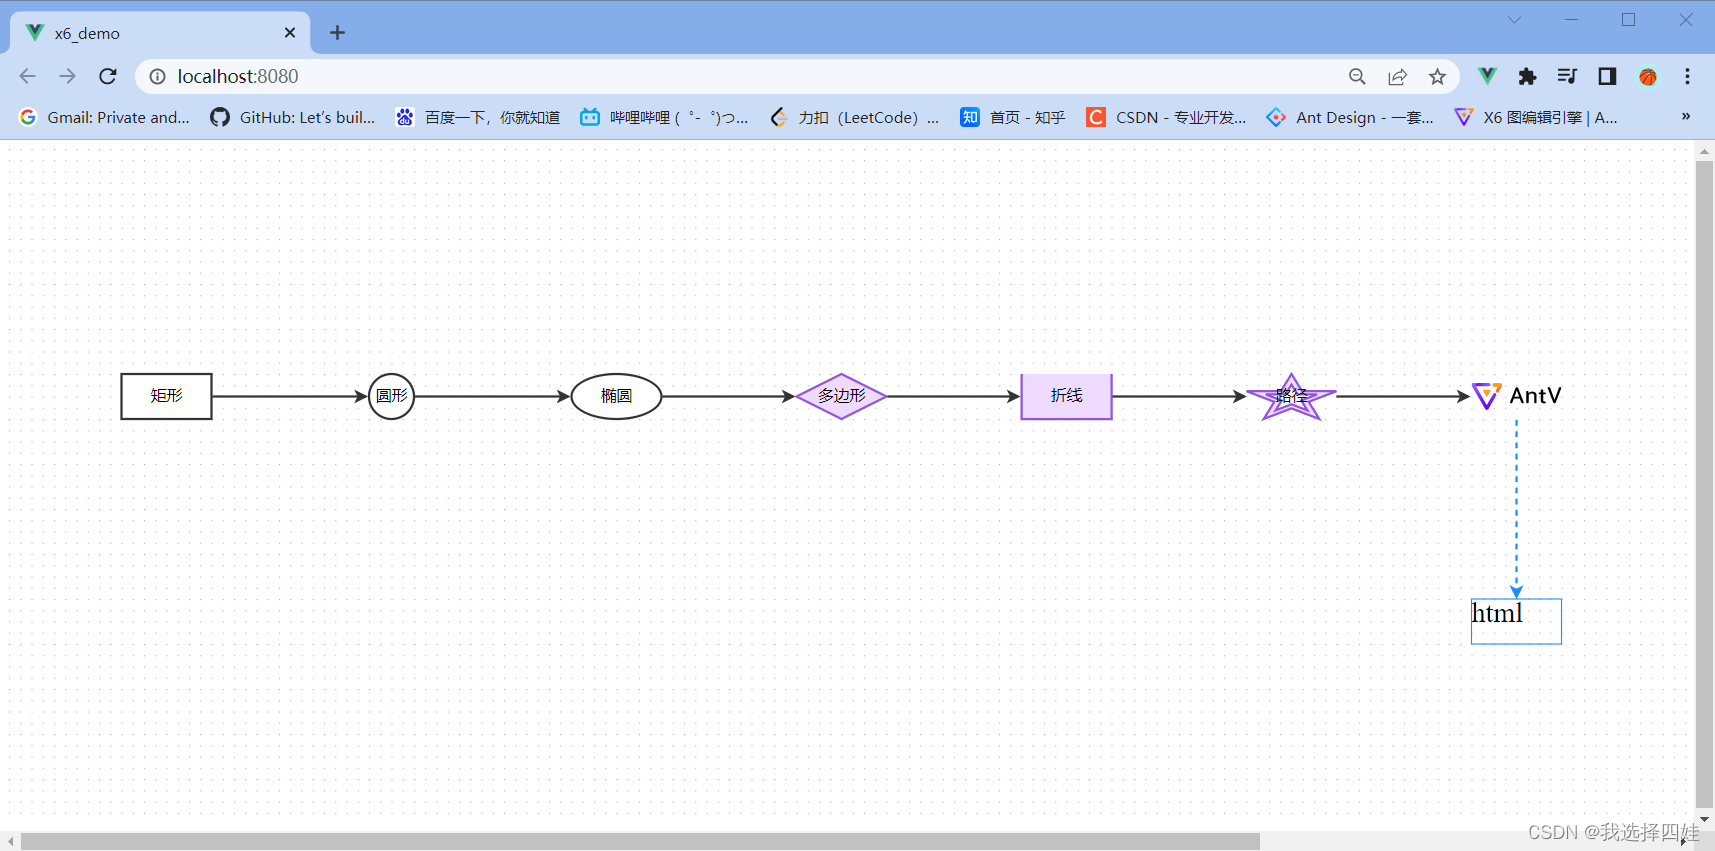
(3)demo3:节点和边的配置
- demo3.vue
<template>
  <div id="container"></div>
</template>

<script>
import {Graph, Shape} from '@antv/x6'
import {onMounted} from "vue"

const node11 = new Shape.HTML({
  id: 'node11',
  x: 1300,
  y: 400,
  width: 80,
  height: 40,
  attrs:{
    body:{
      stroke: '#1890ff',
    },
    label: {
      text: "html",
      fontSize: 25,
    },
  },
})

const edge7_11 = new Shape.Edge({
  source: 'node7',
  target: 'node11',
  attrs: {
    line: {
      stroke: '#1890ff',
      strokeDasharray: 5,
      targetMarker: 'classic',
    }
  },
})

const data = {
  nodes: [
    {
      id: 'node1',
      shape: 'rect',
      x: 100,
      y: 200,
      width: 80,
      height: 40,
      label: '矩形'
    },
    {
      id: 'node2',
      shape: 'circle',
      x: 300,
      y: 200,
      width: 80,
      height: 40,
      label: '圆形'
    },
    {
      id: 'node3',
      shape: 'ellipse',
      x: 500,
      y: 200,
      width: 80,
      height: 40,
      label: '椭圆'
    },
    {
      id: 'node4',
      shape: 'polygon',
      x: 700,
      y: 200,
      width: 80,
      height: 40,
      label: '多边形',
      attrs: {
        body: {
          // 填充色
          fill: '#efdbff',
          // 边框色
          stroke: '#9254de',
          // 设置了4组,四边形,代表四个点的偏移,与width、height、x、y一起看
          // 点之间都连接
          refPoints: '0,10 10,0 20,10 10,20',
        }
      }
    },
    {
      id: 'node5',
      shape: 'polyline',
      x: 900,
      y: 200,
      width: 80,
      height: 40,
      label: '折线',
      attrs: {
        body: {
          fill: '#efdbff',
          stroke: '#9254de',
          // 点之间只连两两,最后一个和第一个不连
          refPoints: '0,0 0,10 10,10 10,0'
        }
      }
    },
    {
      id: 'node6',
      shape: 'path',
      x: 1100,
      y: 200,
      width: 80,
      height: 40,
      label: '路径',
      // svg格式的path格式
      // path: 'M 0 5 10 0 C 20 0 20 20 10 20 L 0 15 Z',
      path: 'm468.21502,252.08332l-72.97137,0l-22.52531,-66.80479l-3.16285,9.33589l-19.38904,57.4817l-72.95144,-0.01281l59.01764,41.32638l-22.56518,66.84961l59.03093,-41.32638l59.04422,41.34559l-22.57182,-66.86882l59.04422,-41.32638zm-87.69588,56.4892l-7.80745,-5.46195l-7.80745,5.46835l-25.92736,18.14672l9.90051,-29.35236l2.99009,-8.84925l-7.82073,-5.47475l-25.91407,-18.14672l41.69508,0l2.99009,-8.84285l9.89386,-29.35236l9.89386,29.33315l2.98344,8.84285l41.73495,0l-25.95394,18.15953l-7.82738,5.46835l2.98344,8.86206l9.92044,29.35236l-25.92736,-18.15313z',
      attrs: {
        body: {
          fill: '#efdbff',
          stroke: '#9254de',
        }
      }
    },
    {
      id: 'node7',
      shape: 'image',
      x: 1300,
      y: 200,
      width: 80,
      height: 40,
      imageUrl: 'https://gw.alipayobjects.com/os/s/prod/antv/assets/image/logo-with-text-73b8a.svg'
    },
    // {
    //   id: 'node8',
    //   shape: "image-bordered",
    //   x: 1300,
    //   y: 400,
    //   width: 80,
    //   height: 40,
    //   imageUrl: 'https://gw.alipayobjects.com/os/s/prod/antv/assets/image/logo-with-text-73b8a.svg'
    // },
    // {
    //   id: 'node9',
    //   shape: 'image-embedded',
    //   x: 1100,
    //   y: 400,
    //   width: 80,
    //   height: 40,
    //   imageUrl: 'https://img2-bs.511doc.com/mark/00/00/37/42/32e7b926810f3bd87e6e46a3226a3bdf.jpg%21/quality/90/unsharp/true/compress/true/fw/640/clip/640x500a0a500'
    // },
    // {
    //   id: 'node10',
    //   shape: 'image-inscribed',
    //   x: 900,
    //   y: 400,
    //   width: 80,
    //   height: 40,
    //   imageUrl: 'https://img2-bs.511doc.com/mark/00/00/37/42/32e7b926810f3bd87e6e46a3226a3bdf.jpg%21/quality/90/unsharp/true/compress/true/fw/640/clip/640x500a0a500'
    // },
  ],
  edges: [
    {
      source: 'node1',
      target: 'node2',
    },
    {
      source: 'node2',
      target: 'node3',
    },
    {
      shape: 'edge',
      source: 'node3',
      target: 'node4',
    },
    {
      shape: 'edge',
      source: 'node4',
      target: 'node5',
    },
    {
      shape: 'edge',
      source: 'node5',
      target: 'node6',
    },
    {
      shape: 'edge',
      source: 'node6',
      target: 'node7',
    },
    // {
    //   shape: 'edge',
    //   source: 'node7',
    //   target: 'node11',
    // },
  ]
}

export default {
  name: 'demo3',
  setup() {
    onMounted(() => {
      let graph = new Graph({
        container: document.getElementById('container'),
        width: 2000,
        height: 600,
        grid: true,
      });
      graph.fromJSON(data);
      graph.addNode(node11);
      graph.addEdge(edge7_11)
    })
  }
}
</script>

<style scoped>
</style>
二、画布
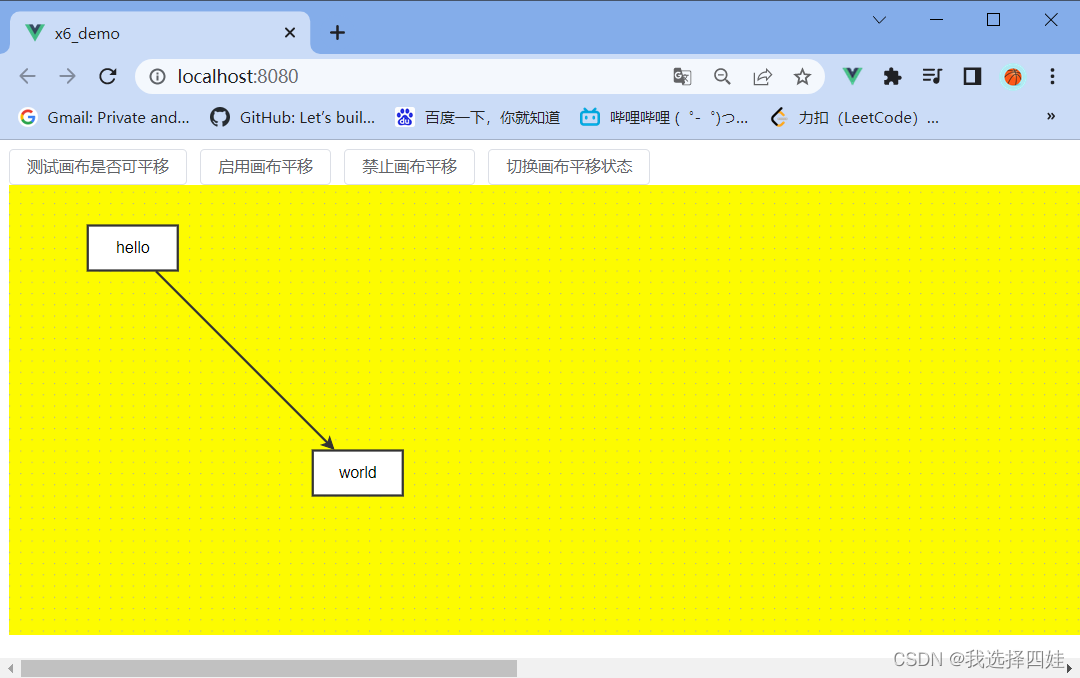
(1)Graph、Panning、MouseWheel
<template>
  <el-button @click="ifPannable">测试画布是否可平移</el-button>
  <el-button @click="startPanning">启用画布平移</el-button>
  <el-button @click="endPanning">禁止画布平移</el-button>
  <el-button @click="changePanning">切换画布平移状态</el-button>
  <div id="container"></div>
</template>

<script>
import {Graph} from '@antv/x6'
import {onMounted, defineComponent} from "vue";

const data = {
  // 定义节点和边
  nodes: [
    {
      id: 'node1',
      x: 0,
      y: 0,
      width: 80,
      height: 40,
      label: 'hello'
    },
    {
      id: 'node2',
      x: 200,
      y: 200,
      width: 80,
      height: 40,
      label: 'world'
    }
  ],
  edges: [
    {
      source: 'node1',
      target: 'node2',
    }
  ]
}

export default defineComponent({
  name: 'huaBu',
  setup() {
    let graph = {}
    onMounted(() => {
      graph = new Graph({
        container: document.getElementById('container'),
        width: 2000,
        height: 400,
        grid: {
          size: 10,
          visible: true,
        },
        background: {
          color: '#fdfb01'
        },

        // 画布平移
        // panning: true,
        panning: {
          enabled: true,
          modifiers: 'shift',  // 按下shift+左键才会移动,防止冲突
          eventTypes: ['leftMouseDown', 'rightMouseDown'],  // 或单选之一,还可选mouseWheel
        },

        // 滚轮配合画布实现缩放
        scroller: {
          enabled: true,
          pannable: true,
          pageVisible: true,
          pageBreak: false,
        },
        mousewheel: {
          enabled: true,
          factor: 1.2,
          modifiers: ["alt", "shift"],
          // 判断滚轮事件是否被处理,当按下shift滚动滑轮时,不缩放
          // g是graph当前画布,e是wheelEvent滚轮事件
          guard(g, e){
            if(e.altKey){
              return false
            }
            return true
          }
        },
      })

      graph.fromJSON(data);
    })

    // 画布是否可平移
    function ifPannable(){
      console.log(graph.isPannable())
    }

    // 启用画布平移
    function startPanning(){
      graph.enablePanning()
      console.log('已启用画布平移')
    }

    // 禁止画布平移
    function endPanning(){
      graph.disablePanning()
      console.log('已禁用画布平移')
    }

    // 切换画布平移状态
    function changePanning(){
      graph.togglePanning()
      console.log('已切换画布平移状态')
    }

    return {
      ifPannable,
      startPanning,
      endPanning,
      changePanning,
    }
  }
})
</script>

<style scoped>
</style>
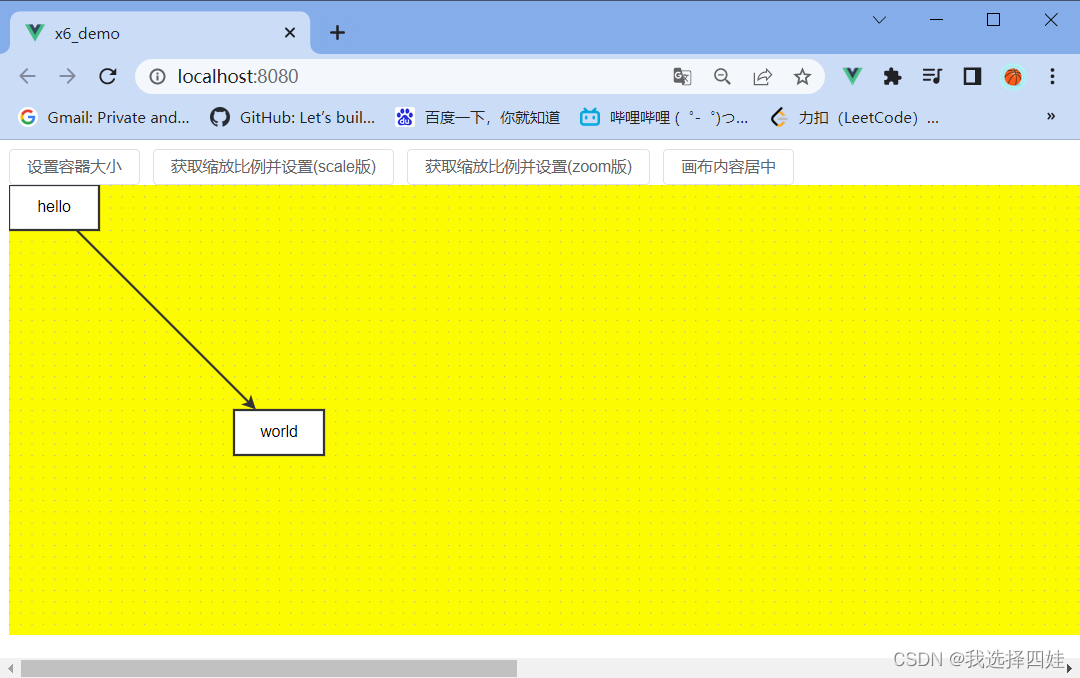
(2)Transform
<template>
  <el-button @click="reSize">设置容器大小</el-button>
  <el-button @click="getAndSetPercent">获取缩放比例并设置(scale版)</el-button>
  <el-button @click="getAndSetPercentZoom">获取缩放比例并设置(zoom版)</el-button>
  <el-button @click="contentToCenter">画布内容居中</el-button>
  <div id="container"></div>
</template>

<script>
import {Graph} from '@antv/x6'
import {onMounted, defineComponent} from "vue";

const data = {
  // 定义节点和边
  nodes: [
    {
      id: 'node1',
      x: 0,
      y: 0,
      width: 80,
      height: 40,
      label: 'hello'
    },
    {
      id: 'node2',
      x: 200,
      y: 200,
      width: 80,
      height: 40,
      label: 'world'
    }
  ],
  edges: [
    {
      source: 'node1',
      target: 'node2',
    }
  ]
}

export default defineComponent({
  name: 'huaBu2',
  setup() {
    let graph = {}
    onMounted(() => {
      graph = new Graph({
        container: document.getElementById('container'),
        width: 2000,
        height: 400,
        grid: {
          size: 10,
          visible: true,
        },
        background: {
          color: '#fdfb01'
        },

        // 配置画布最大最小缩放比
        scaling: {
          min: 0.05,  // 默认0.01
          max: 12,  // 默认16
        }
      })

      graph.fromJSON(data);
    })

    // 设置容器大小
    function reSize(){
      graph.resize(700, 400)
    }

    // 获取当前画布缩放比例,并设置,scale版(1表示不缩放,无负数)
    function getAndSetPercent(){
      console.log(graph.scale())
      setTimeout(()=>{
        graph.scale(0.5, 0.5, 0, 0)  // x轴缩放比例、y轴缩放比例、缩放中心x坐标、缩放中心y坐标
      }, 2000)
    }

    // 获取当前画布缩放比例,并设置,Zoom版(0表示不缩放,大于0放大小于0缩小)
    function getAndSetPercentZoom(){
      console.log(graph.zoom())
      setTimeout(()=> {
        graph.zoom(0.1, false)  // 缩放比例、是否绝对缩放
      }, 2000)
    }

    // 画布内容居中
    function contentToCenter(){
      graph.centerContent()
    }

    return {
      reSize,
      getAndSetPercent,
      getAndSetPercentZoom,
      contentToCenter,
    }
  }
})
</script>

<style scoped>
</style>
三、基类Cell
(1)addNode和addEdge、markup和选择器
- cellDemo1.vue
<template>
  <el-button @click="addNodeAndEdge">addNode、addEdge添加点和边</el-button>
  <el-button @click="addCustomNode">添加自定义节点测试markup</el-button>
  <div id="container"></div>
</template>

<script>
import {Graph, Shape, Node} from '@antv/x6'
import {onMounted, defineComponent} from "vue";

export default defineComponent({
  name: 'cellDemo1',
  setup() {
    let graph = {}
    onMounted(() => {
      graph = new Graph({
        container: document.getElementById('container'),
        width: 2000,
        height: 400,
        grid: true,
        background:{
          color: '#e0e07c'
        }
      })
    })

    // addNode和addEdge
    function addNodeAndEdge() {
      const rect = new Shape.Rect({
        id: "node1",
        x: 100,
        y: 200,
        width: 80,
        height: 40,
        label: "rect",
        attrs: {
          body: {
            stroke: 'blue',
            fill: 'red'
          },
          label: {
            text: 'rect',
            fill: '#333'
          }
        },
      });

      const circle = new Shape.Circle({
        id: "node2",
        x: 280,
        y: 200,
        width: 60,
        height: 60,
        label: "circle",
      });
      const edge = new Shape.Edge({
        source: rect,
        target: circle,
      });
      graph.addNode(rect)
      graph.addNode(circle)
      graph.addEdge(edge)
    }

    // 自定义节点,演示markup属性
    function addCustomNode(){
      const customNode = new Node({
        x: 100,
        y: 100,
        width: 80,
        height: 40,
        // markup搭配attrs使用,markup会覆盖
        markup: [
          {
            tagName: 'rect',
            selector: 'body111',
          },
          {
            tagName: 'text',
            selector: 'label111',
          },
        ],
        attrs: {
          // 此处可以写rect/body111,text/label111
          body111: {
            stroke: '#000',
            fill: '#fff',
            ref: 'label111',  // 文本要在矩形里边
            rx: 3,
            ry: 3,
            refWidth: 100,
            refHeight: 100,
            refX: -50,
            refY: -50,
          },
          text: {
            fontSize: 14,
            textAnchor: 'middle',
            textVerticalAnchor: 'middle'
          },
          label111: {
            text: '自定义node'
          }
        }
      })
      console.log('正在添加自定义节点')
      graph.addNode(customNode)
      console.log('添加完成')
    }

    // 组选择器groupSelector,文字label和文字content的公共部分放textGroup
    // markup: [
    //   {
    //     tagName: 'rect',
    //     selector: 'body',
    //   },
    //   {
    //     tagName: 'text',
    //     selector: 'label',
    //     groupSelector: 'textGroup'
    //   },
    //   {
    //     tagName: 'text',
    //     selector: 'content',
    //     groupSelector: 'textGroup'
    //   }
    // ]

    // 优先级:selector > groupSelector > tagName

    return {
      addNodeAndEdge,
      addCustomNode,
    }
  }
})
</script>

<style scoped>
</style>
(2)自定义节点添加图片、自定义节点定制Css
- cellDemo2.vue
<template>
  <el-button @click="addCustomNode">添加自定义节点image</el-button>
  <el-button @click="addNodeCss">添加自定义节点测试Css</el-button>
  <div id="container"></div>
</template>

<script>
import {Graph, Shape} from '@antv/x6'
import {onMounted, defineComponent} from "vue";

export default defineComponent({
  name: 'cellDemo2',
  setup() {
    let graph = {}
    onMounted(() => {
      graph = new Graph({
        container: document.getElementById('container'),
        width: 2000,
        height: 400,
        grid: true,
        background:{
          color: '#e0e07c'
        }
      })
    })

    // 自定义节点,加图片
    function addCustomNode(){
      const customNode = new Shape.Rect({
        x: 100,
        y: 100,
        width: 200,
        height: 100,
        markup: [
          {
            tagName: 'rect',
            selector: 'body',
          },
          {
            tagName: 'text',
            selector: 'label1',
          },
          {
            tagName: 'text',
            selector: 'label2',
          },
          {
            tagName: 'image',
            selector: 'image',
          }
        ],
        attrs: {
          body: {
            stroke: '#5f95ff',
            strokeWidth: 1,
            fill: '#afafaf'
          },
          image: {
            'xlink:href': 'https://gw.alipayobjects.com/os/s/prod/antv/assets/image/logo-with-text-73b8a.svg',
            width: 40,
            height: 40,
            x: 10,
            y: 10,
          },
          label1: {
            text: 'label1:Node',
            refX: 50,
            refY: 50,
            fontSize: 10,
            fill: '#000',
            'text-anchor': 'start',  // middle、end,决定文字的哪一端位于refX、refY偏移后的位置
          },
          label2: {
            text: 'label2:Welcome cufeuzi',
            refX: 50,
            refY: 70,
            fontSize: 10,
            fill: '#000',
            'text-anchor': 'start'
          }
        }
      })
      graph.addNode(customNode)
    }

    // 自定义节点,定制css
    function addNodeCss(){
        const nodeCss = new Shape.Circle({
          x: 400,
          y: 100,
          width: 200,
          height: 100,
          markup: [
            {
              tagName: 'circle',
              selector: 'body',
            },
            {
              tagName: 'text',
              selector: 'label',
            }
          ],
          attrs: {
            body: {
              fill: '#fff',
              class: 'bodyCss',
              stroke: '#000',
            },
            label: {
              text: 'nodeCss',
              fill: 'blue',
            }
          }
        })
      graph.addNode(nodeCss)
    }

    return {
      addCustomNode,
      addNodeCss,
    }
  }
})
</script>

<style scoped>
#container :deep(.bodyCss) {
  fill: #00fd35;
}
</style>
(3)添加文本节点、通过控制面板控制属性
- cellDemo3.vue
<template>
  <a-row :gutter="[8, 8]">
    <el-button @click="addTextNode">添加文本节点</el-button>
    <el-button @click="controlChange">通过控制面板修改属性</el-button>
    <el-button @click="toJson">toJSON</el-button>
  </a-row>
  <a-row :gutter="[16, 8]" style="padding-top: 10px">
    <a-col :span="20">
      <div id="container"></div>
    </a-col>
    <a-col :span="4">
      <!-- :model可以父组件传给子组件,但不能反向 -->
      <a-form :model="formState">
        <a-form-item label="标题" v-show="formState.title !== null">
          <!-- 此处必须v-model:value=,不能v-model=,暂不知原理 -->
          <a-input v-model:value="formState.title" @change="onTitleChange"></a-input>
        </a-form-item>

        <a-form-item label="用户" v-show="formState.userId !== null">
          <a-select v-model:value="formState.userId" placeholder="请选择用户" @change="onUserIdChange">
            <a-select-option :value=1>张三</a-select-option>
            <a-select-option :value=2>李四</a-select-option>
          </a-select>
        </a-form-item>

        <a-form-item label="角色" v-show="formState.roleId !== null">
          <a-select v-model:value="formState.roleId" placeholder="请选择角色" @change="onRoleIdChange">
            <a-select-option :value=1>管理员</a-select-option>
            <a-select-option :value=2>普通用户</a-select-option>
          </a-select>
        </a-form-item>
      </a-form>
    </a-col>
  </a-row>
</template>

<script>
import {Graph, Shape, Cell} from '@antv/x6'
import {onMounted, reactive, defineComponent, nextTick} from "vue";

export default defineComponent({
  name: 'cellDemo3',
  setup() {
    // 双向数据绑定
    const formState = reactive({
      title: null,
      userId: null,
      roleId: null,
    })
    let graph = {}
    let curCel = new Cell()
    onMounted(() => {
      graph = new Graph({
        container: document.getElementById('container'),
        height: 400,
        grid: true,
        background:{
          color: '#e0e07c'
        }
      })
    })

    // 点击鼠标时
    nextTick(()=>{
      // 当去点击的cell
      graph.on('cell:click', ({cell})=>{
        // console.log(cell.getAttrs(), cell.getData())
        // 原cell边框变黑
        curCel.attr('body/stroke', null)
        curCel = cell
        // 当前cell边框变红
        curCel.attr('body/stroke', 'red')
        let labelText = null;
        if(cell.getAttrs().text.text) labelText = cell.getAttrs().text.text
        if(cell.getAttrs().label.text) labelText = cell.getAttrs().label.text
        formState.title = labelText
        formState.userId = cell.getData()? cell.getData().userId : undefined
        formState.roleId = cell.getData()? cell.getData().roleId : undefined
        // console.log(formState)
      })
    })

    function onTitleChange(){
      curCel.attr('label/text', formState.title)
    }

    function onUserIdChange(){
      curCel.setData({
        userId: formState.userId
      })
    }

    function onRoleIdChange(){
      curCel.setData({
        roleId: formState.roleId
      })
    }

    // 自定义节点,加图片
    function addTextNode(){
      const textNode = new Shape.TextBlock({
        x: 200,
        y: 40,
        width: 300,
        height: 120,
        text: '我是cufeuzi你是谁啊',
        attrs: {
          label: {
            contenteditable: 'true',
          },
          body: {
            fill: '#efdbff',
            stroke: '#9254de',
            rx: 4,
            ry: 4,
          }
        }
      })
      graph.addNode(textNode)
    }

    // 控制面板修改属性
    function controlChange(){
      const node = new Shape.Rect({
        x: 300,
        y: 200,
        width: 200,
        height: 60,
        attrs: {
          label: {
            text: 'rect',
            fill: 'blue',
          }
        },
        data: {
          userId: 1,
          roleId: 1,
        }
      })
      graph.addNode(node)
    }

    // 控制台输出画布的JSON格式数据
    function toJson(){
      console.log(graph.toJSON())
    }

    return {
      addTextNode,
      controlChange,
      toJson,
      formState,
      onTitleChange,
      onUserIdChange,
      onRoleIdChange,
    }
  }
})
</script>

<style scoped>
</style>

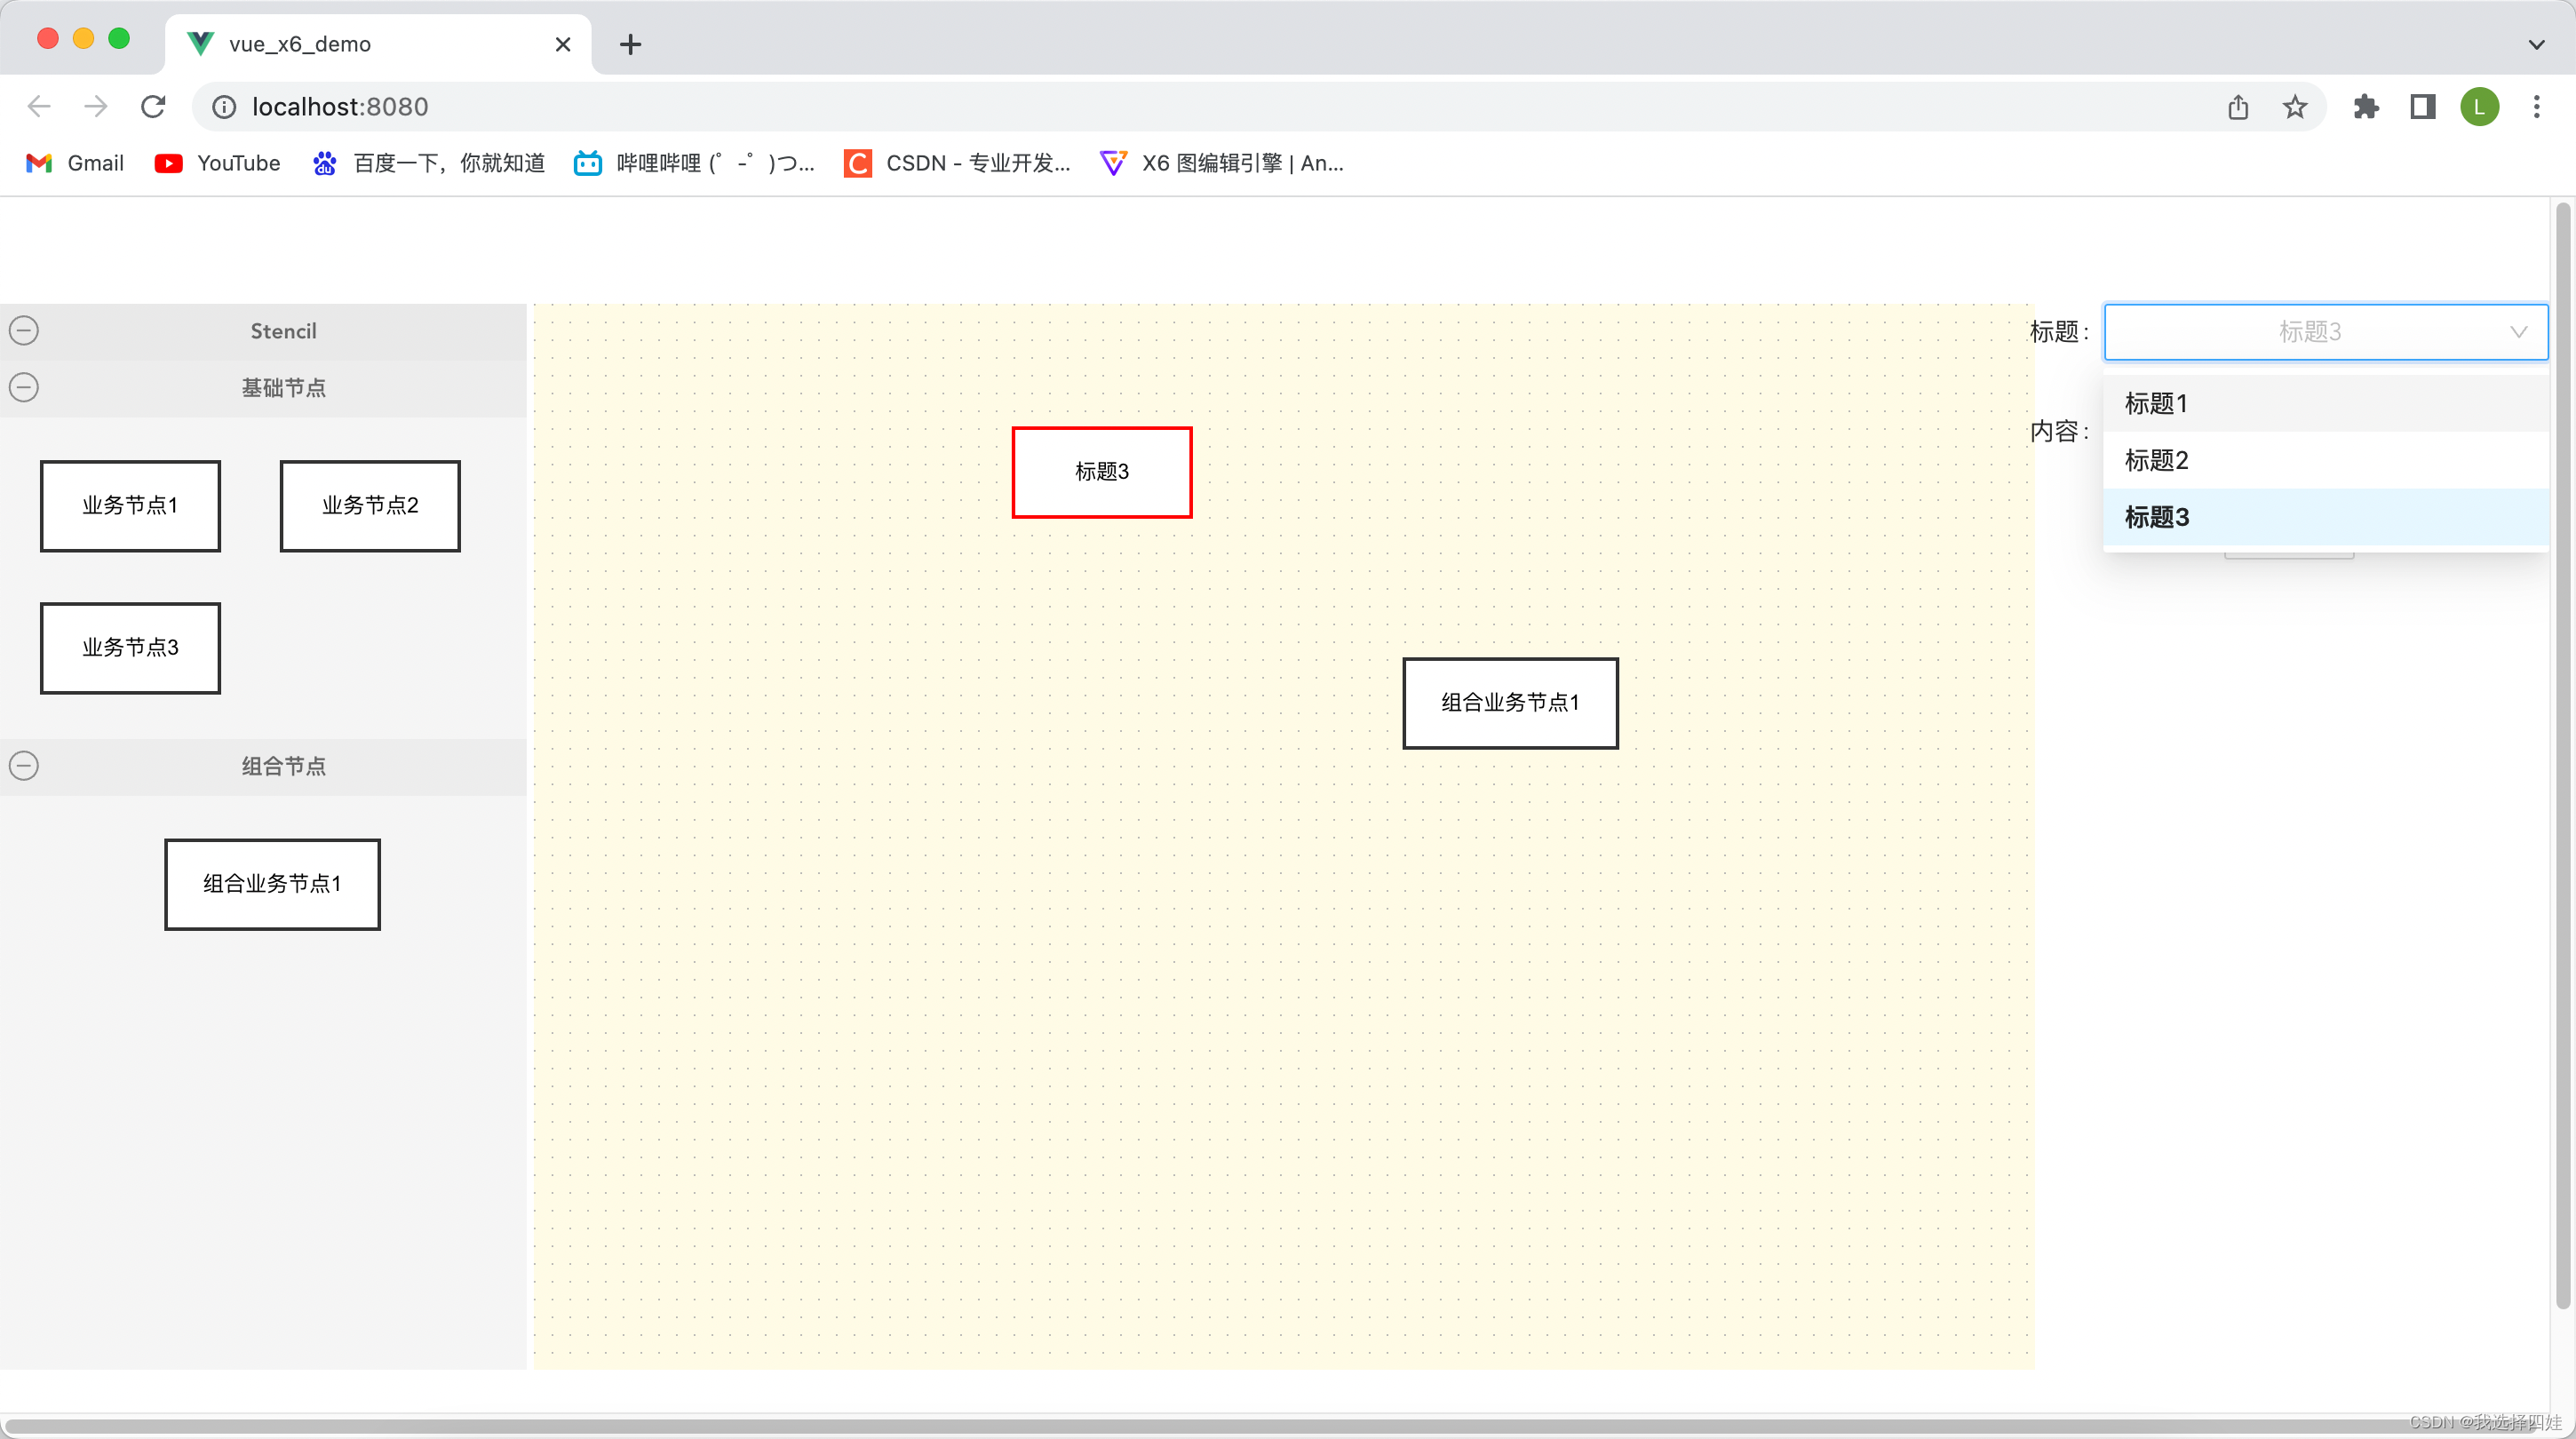
(4)拖拽式页面基本案例
- cellDemo4.vue
<template>
  <a-row :gutter="[8, 8]">
<!--  gutter表示水平(col和col之间)和垂直(row和row之间)间隔,span表示每个col在水平方向所占大小(总共24)  -->
    <a-col :span="5">
      <div id="stencil"></div>
    </a-col>
    <a-col :span="14">
      <div id="container"></div>
    </a-col>
    <a-col :span="5">
      <a-form :model="formData">
        <a-form-item label="标题" v-show="formData.id !== null">
          <a-select v-model:value="formData.id" placeholder="请选择数据" @change="onIdChange">
            <a-select-option
              v-for="item in dropdownData.tableData"
              :key="item.id"
              :value="item.id">
              {{ item.title }}
            </a-select-option>
          </a-select>
        </a-form-item>

        <a-form-item label="内容" v-show="formData.content !== null">
          <a-input v-model:value="formData.content" @change="onContentChange"/>
        </a-form-item>

        <a-button @click="toJson">toJson</a-button>
      </a-form>
    </a-col>
  </a-row>

</template>

<script>
import {Graph, Shape} from "@antv/x6";
import {Stencil} from "@antv/x6-plugin-stencil";
import {onMounted, reactive} from "vue";

const tableData = [
  {
    id: 1,
    title: '标题1',
    content: '内容1',
  },
  {
    id: 2,
    title: '标题2',
    content: '内容2',
  },
  {
    id: 3,
    title: '标题3',
    content: '内容3',
  }
]

export default {
  name: "cellDemo4",
  setup(){
    let graph = null;
    let stencil = null;
    let curCel = null;

    // 构建当前画布
    function buildGraph(){
      graph = new Graph({
        container: document.getElementById('container'),
        height: 600,
        background: {
          color: '#fffbe6',
        },
        grid: {
          size: 10,
          visible: true,
        }
      })
    }

    // 构建左侧菜单栏
    function buildStencil(){
      stencil = new Stencil({
        target: graph,
        stencilGraphWidth: 290,
        // 是否可折叠
        collapsable: true,
        groups: [
          {
            name: 'basic',
            title: '基础节点',
            graphHeight: 180,
          },
          {
            name: 'combination',
            title: '组合节点',
            layoutOptions: {
              columns: 1,
              marginX: 80,
            },
            graphHeight: 260,
          }
        ]
      })
      document.querySelector('#stencil').appendChild(stencil.container)
    }

    // 左侧菜单栏节点
    function stencilLoadNode(){
      const bizNode1 = new Shape.Rect({
        width: 100,
        height: 50,
        attrs: {
          label: {
            fontSize: 12,
            text: '业务节点1',
          }
        }
      })
      const bizNode2 = new Shape.Rect({
        width: 100,
        height: 50,
        attrs: {
          label: {
            fontSize: 12,
            text: '业务节点2',
          }
        }
      })
      const bizNode3 = new Shape.Rect({
        width: 100,
        height: 50,
        attrs: {
          label: {
            fontSize: 12,
            text: '业务节点3',
          }
        }
      })
      const bizNode4 = new Shape.Rect({
        width: 120,
        height: 50,
        attrs: {
          label: {
            fontSize: 12,
            text: '组合业务节点1',
          }
        }
      })
      stencil.load([bizNode1, bizNode2, bizNode3], 'basic')
      stencil.load([bizNode4], 'combination')
    }

    // 表单数据定义
    let formData = reactive({
      id: null,
      title: null,
      content: null,
    })

    // 节点点击事件
    function initEvent(){
      graph.on('cell:click', ({cell})=>{
        console.log(cell.getAttrs())
        if(curCel != null)
          curCel.attr('body/stroke', null)
        curCel = cell
        curCel.attr('body/stroke', 'red')
        formData.id = cell.getData()? cell.getData().id: undefined

        if(formData.id){
          setTimeout(()=>{
            const tableDataRow = tableData.filter(item => item.id === formData.id)[0]
            formData.title = tableDataRow.title
            formData.content = tableDataRow.content
          }, 100)
        }else{
          formData.title = null
          formData.content = null
        }
      })
    }

    // 定义下拉数据
    const dropdownData = reactive({
      tableData: [],
    })

    onMounted(()=>{
      buildGraph();
      buildStencil();
      stencilLoadNode();
      initEvent();
      setTimeout(()=>{
        dropdownData.tableData = tableData;
      }, 1000);
    })

    function onIdChange(){
      setTimeout(()=>{
        const tableDataRow = tableData.filter(item => item.id === formData.id)[0]
        formData.title = tableDataRow.title
        formData.content = tableDataRow.content

        curCel.setData({
          id: formData.id,
          content: formData.content
        })
        curCel.attr('label/text', formData.title)
      }, 100)
    }

    function onContentChange(){
      curCel.data.content = formData.content
    }

    function toJson(){
      console.log(graph.toJSON())
    }

    return{
      formData,
      dropdownData,
      onIdChange,
      onContentChange,
      toJson,
    }
  }
}
</script>

<style scoped>

</style>
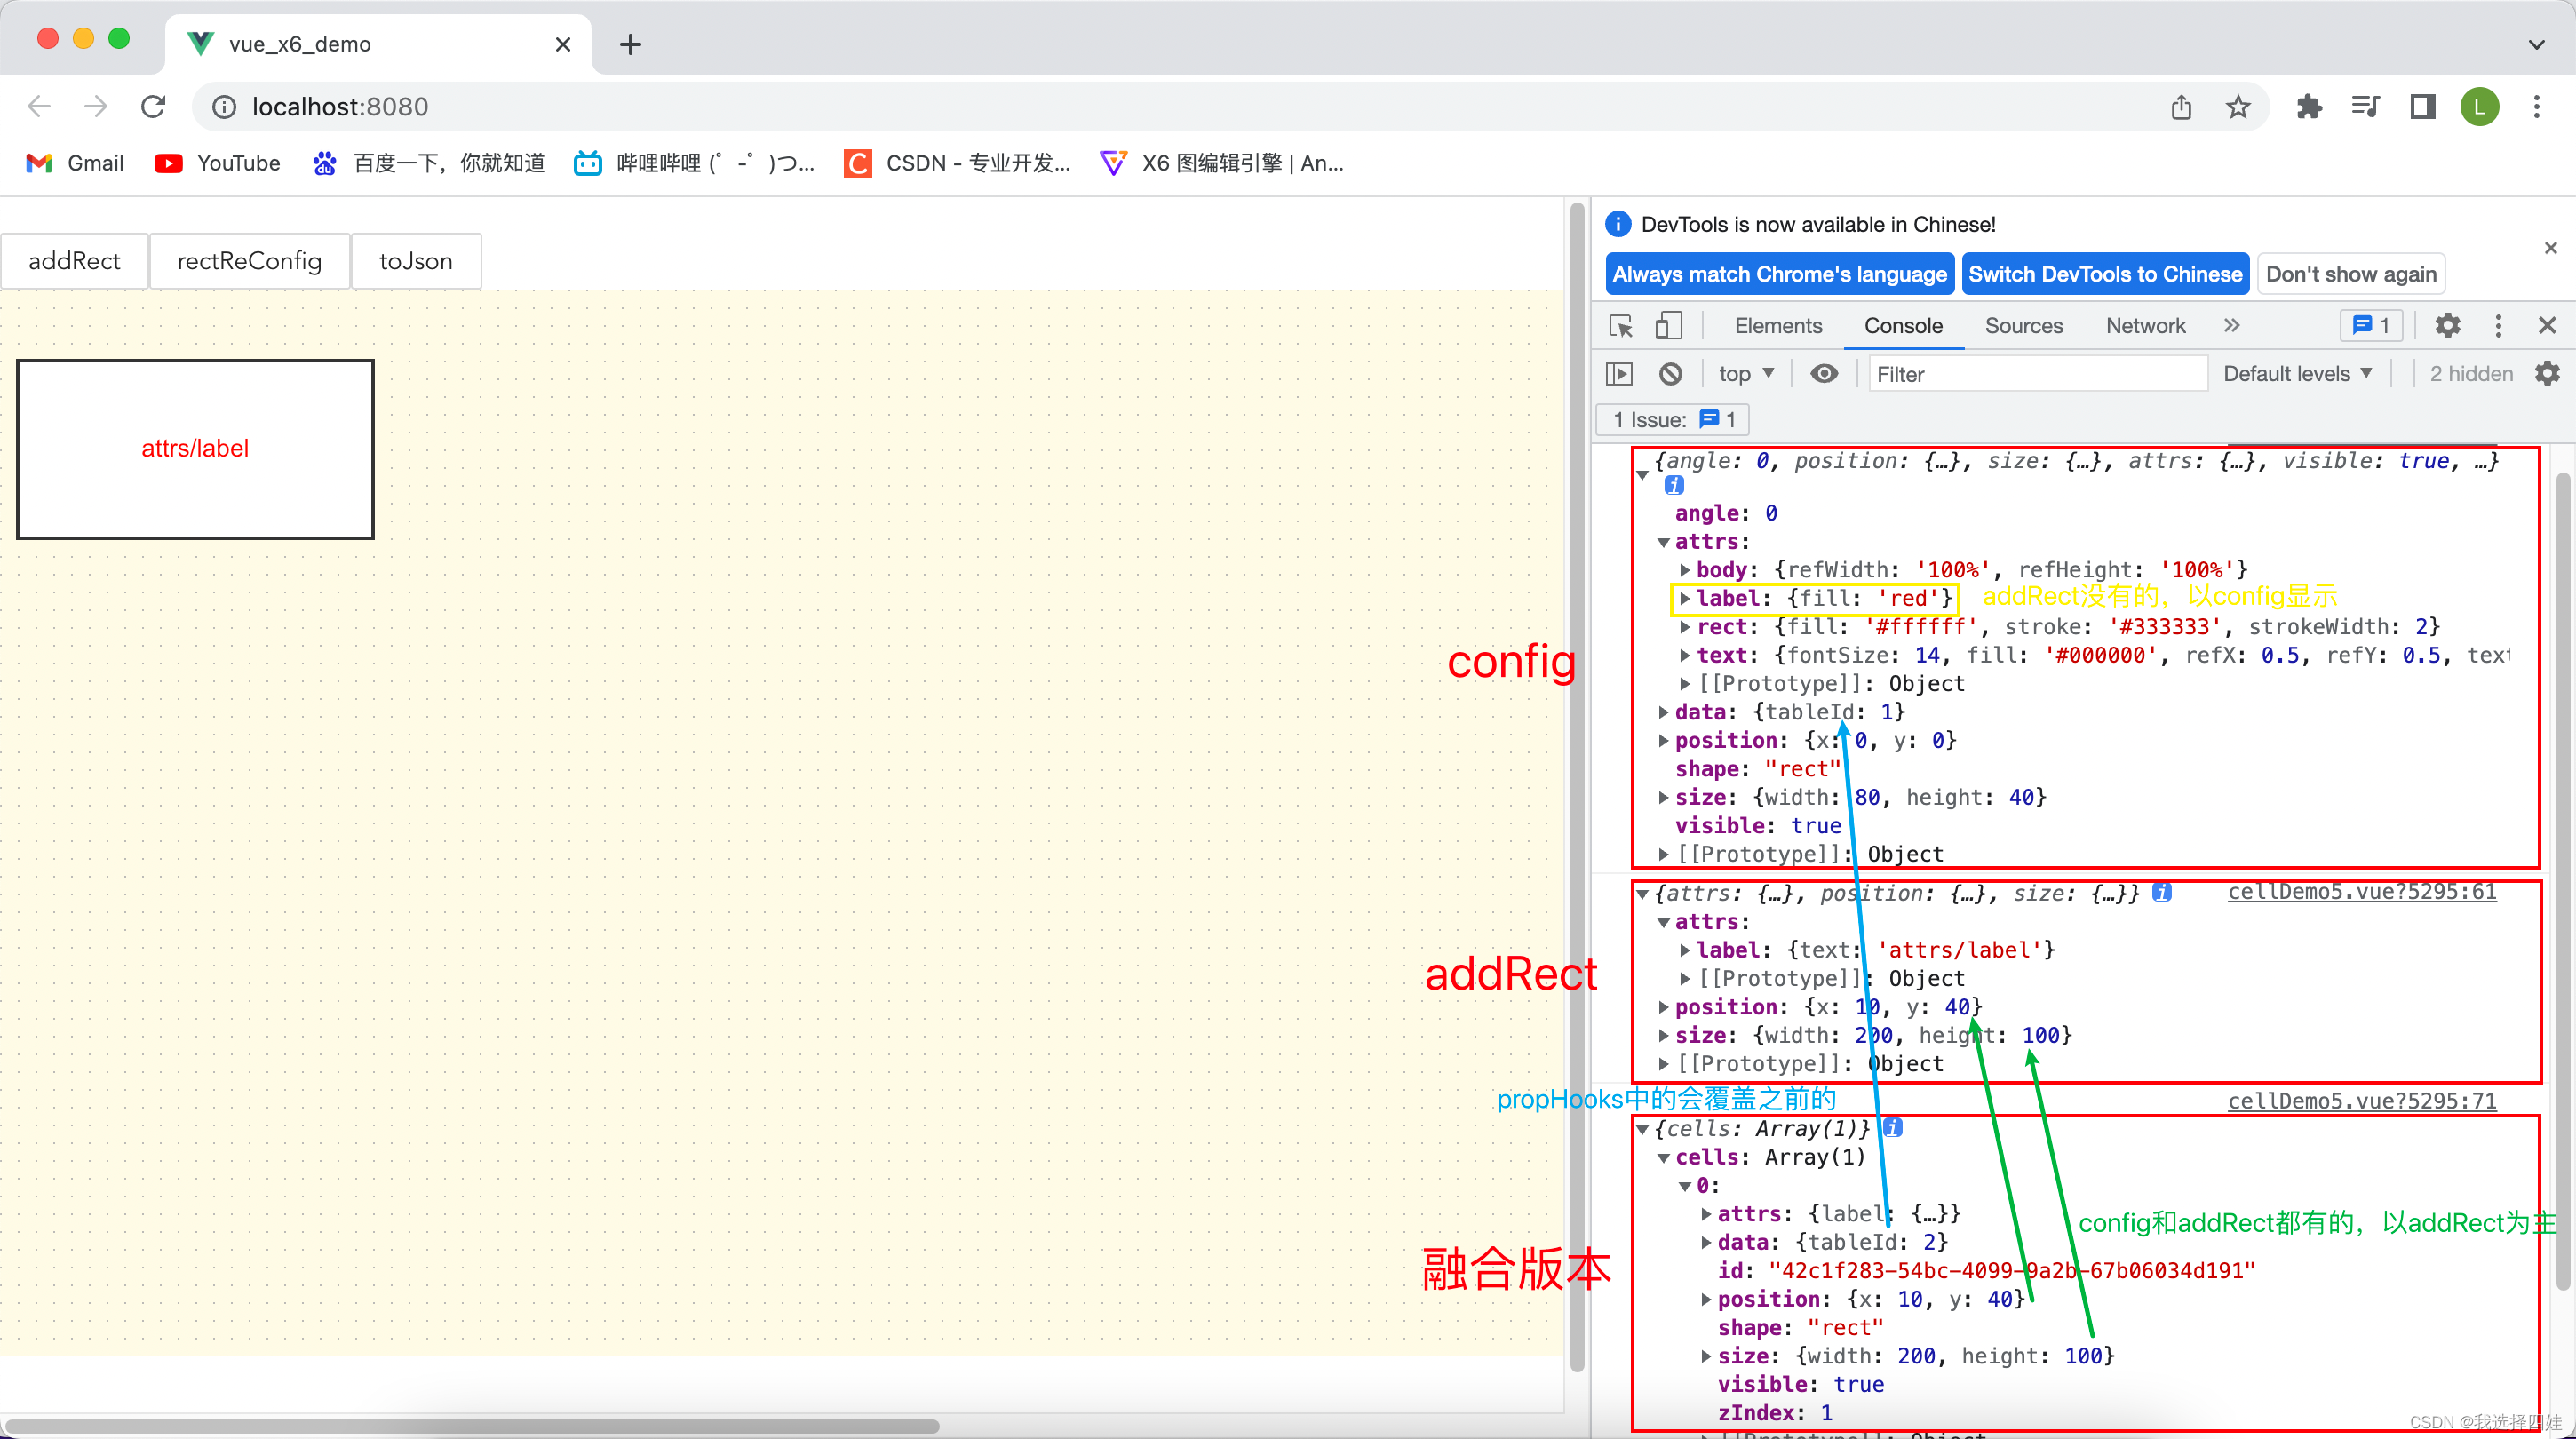
(5)设置默认的condig、使用propHooks
- cellDemo5.vue
<template>
  <a-button @click="addRect">addRect</a-button>
  <a-button @click="rectReConfig">rectReConfig</a-button>
  <a-button @click="toJson">toJson</a-button>
  <div id="container"></div>
</template>

<script>
import {defineComponent, onMounted} from "vue";
import {Graph, Shape, Node, ObjectExt} from "@antv/x6";

export default defineComponent({
  name: "cellDemo5",
  setup(){
    let graph;
    onMounted(()=>{
      graph = new Graph({
        container: document.getElementById('container'),
        height: 600,
        background: {
          color: '#fffbe6',
        },
        grid: {
          size: 10,
          visible: true,
        }
      })
    })
    function addRect(){
      const rect = new Shape.Rect({
        x: 10,
        y: 40,
        width: 200,
        height: 100,
        attrs: {
          label: {
            text: 'attrs/label'
          }
        }
      })
      graph.addNode(rect)
    }
    function rectReConfig(){
      Shape.Rect.config({
        // 如果一开始设置了,此处设置不作数
        // 如果一开始没设置(addRect中),则使用此处设置的
        // 最终实际效果为,如果addRect有的,以addRect为主,没有的以config为主(深度融合)
        width: 80,
        height: 40,
        attrs: {
          label: {
            fill: 'red'
          }
        },
        data: {
          tableId: 1
        },
        // 钩子函数打印两次,第一次打印config中的设置,第二次打印addRect中的设置
        // 如果使用ObjectExt,则最终效果包含钩子中内容(覆盖之前)
        propHooks(metadata){
          console.log(metadata)
          const { data, ...others } = metadata
          if(data){
            ObjectExt.setByPath(others, 'data/tableId', 2)
          }
          return others
        }
      })
    }
    function toJson(){
      console.log(graph.toJSON())
    }
    return{
      addRect,
      rectReConfig,
      toJson
    }
  }
})
</script>

<style scoped>

</style>
版权声明:本文为m0_56681374原创文章,遵循 CC 4.0 BY-SA 版权协议,转载请附上原文出处链接和本声明。