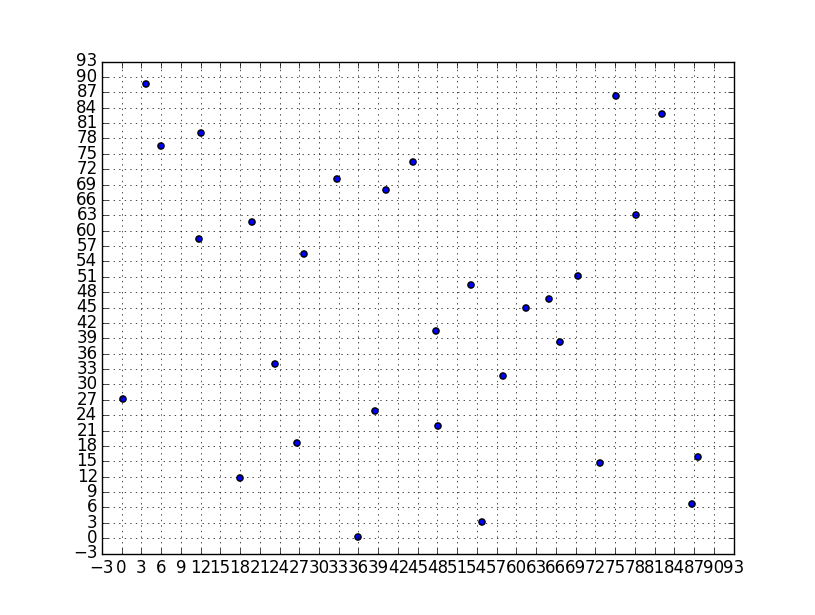
#coding=utf-8
from __future__ import division
__author__ = 'wanghai'
import numpy as np
from matplotlib.ticker import MultipleLocator, FuncFormatter
import matplotlib.pyplot as pl

def LHSample( D,bounds,N):
    '''
    :param D:参数个数
    :param bounds:参数对应范围(list)
    :param N:拉丁超立方层数
    :return:样本数据
    '''

    result = np.empty([N, D])
    temp = np.empty([N])
    d = 1.0 / N

    for i in range(D):

        for j in range(N):
            temp[j] = np.random.uniform(
                low=j * d, high=(j + 1) * d, size = 1)[0]

        np.random.shuffle(temp)

        for j in range(N):
            result[j, i] = temp[j]

    #对样本数据进行拉伸
    b = np.array(bounds)
    lower_bounds = b[:,0]
    upper_bounds = b[:,1]
    if np.any(lower_bounds > upper_bounds):
        print '范围出错'
        return None

    #   sample * (upper_bound - lower_bound) + lower_bound
    np.add(np.multiply(result,
                       (upper_bounds - lower_bounds),
                       out=result),
           lower_bounds,
           out=result)
    return result

if __name__ =='__main__':
    D = 2
    N = 30
    bounds = [[0,90],[0,90]]
    xs = (bounds[0][1] - bounds[0][0])/N
    ys = (bounds[1][1] - bounds[1][0])/N
    ax = pl.gca()
    pl.ylim(bounds[1][0] - ys,bounds[1][1]+ys)
    pl.xlim(bounds[0][0] - xs, bounds[0][1] + xs)
    pl.grid()
    ax.xaxis.set_major_locator( MultipleLocator(xs) )
    ax.yaxis.set_major_locator(MultipleLocator(ys))
    samples = LHSample(D,bounds,N)
    XY = np.array(samples)
    X = XY[:,0]
    Y = XY[:,1]
    pl.scatter(X,Y)
    pl.show()

版权声明:本文为xiaosebi1111原创文章,遵循 CC 4.0 BY-SA 版权协议,转载请附上原文出处链接和本声明。