提示:本文主要对服务监控hystrixDashboard进行总结
文章目录
前言
提示:这里可以添加本文要记录的大概内容:
本文主要对服务监控hystrixDashboard进行总结
提示:以下是本篇文章正文内容
一、概述
除了隔离依赖服务的调用以外,Hystrix还提供了准实时的调用监控(Hystrix Dashboard),Hystrix会持续地记录所有通过Hystrix发起的请求的执行信息,并以统计报表和图形的形式展示给用户,包括每秒执行多少请求多少成功,多少失败等。Netflix通过hystrix-metrics-event-stream项目实现了对以上指标的监控。Spring Cloud也提供了Hystrix Dashboard的整合,对监控内容转化成可视化界面。
二、仪表盘9001
新建cloud-consumer-hystrix-dashboard9001
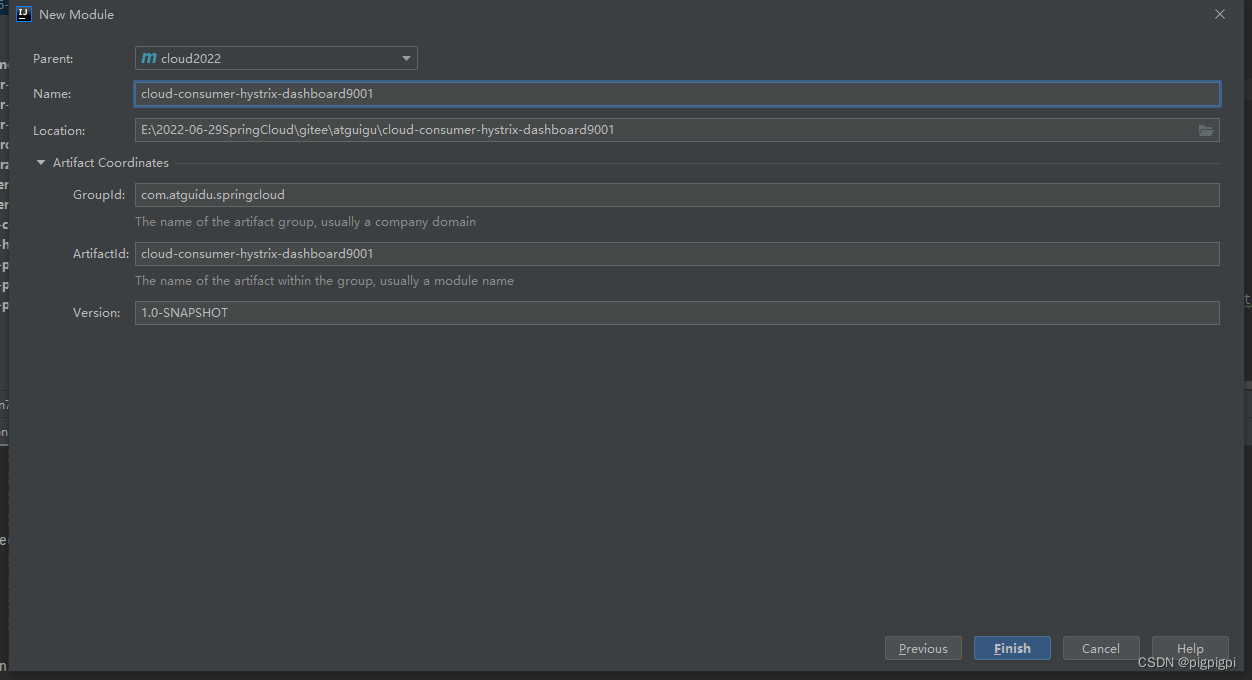
1、pom.xml
<?xml version="1.0" encoding="UTF-8"?>
<project xmlns="http://maven.apache.org/POM/4.0.0"
         xmlns:xsi="http://www.w3.org/2001/XMLSchema-instance"
         xsi:schemaLocation="http://maven.apache.org/POM/4.0.0 http://maven.apache.org/xsd/maven-4.0.0.xsd">
    <parent>
        <artifactId>cloud2022</artifactId>
        <groupId>com.atguidu.springcloud</groupId>
        <version>1.0-SNAPSHOT</version>
    </parent>
    <modelVersion>4.0.0</modelVersion>

    <artifactId>cloud-consumer-hystrix-dashboard9001</artifactId>

    <dependencies>
        <dependency>
            <groupId>org.springframework.cloud</groupId>
            <artifactId>spring-cloud-starter-netflix-hystrix-dashboard</artifactId>
        </dependency>
        <dependency>
            <groupId>org.springframework.boot</groupId>
            <artifactId>spring-boot-starter-actuator</artifactId>
        </dependency>
        <dependency>
            <groupId>org.springframework.boot</groupId>
            <artifactId>spring-boot-devtools</artifactId>
            <scope>runtime</scope>
            <optional>true</optional>
        </dependency>
        <dependency>
            <groupId>org.projectlombok</groupId>
            <artifactId>lombok</artifactId>
            <optional>true</optional>
        </dependency>
        <dependency>
            <groupId>org.springframework.boot</groupId>
            <artifactId>spring-boot-starter-test</artifactId>
            <scope>test</scope>
        </dependency>
    </dependencies>

</project>
2、application.yml
server:
  port: 9001
3、主启动
com.atguigu.springcloud.HystrixDashboardMain9001
HystrixDashboardMain9001+新注解@EnableHystrixDashboard
package com.atguigu.springcloud;

import org.springframework.boot.SpringApplication;
import org.springframework.boot.autoconfigure.SpringBootApplication;
import org.springframework.cloud.netflix.hystrix.dashboard.EnableHystrixDashboard;


@SpringBootApplication
@EnableHystrixDashboard
public class HystrixDashboardMain9001 {
    public static void main(String[] args) {
        SpringApplication.run(HystrixDashboardMain9001.class, args);
    }
}
4、所有Provider微服务提供类(8001/8002/8003)都需要监控依赖配置项
<!-- actuator监控信息完善 -->
<dependency>
    <groupId>org.springframework.boot</groupId>
    <artifactId>spring-boot-starter-actuator</artifactId>
</dependency>
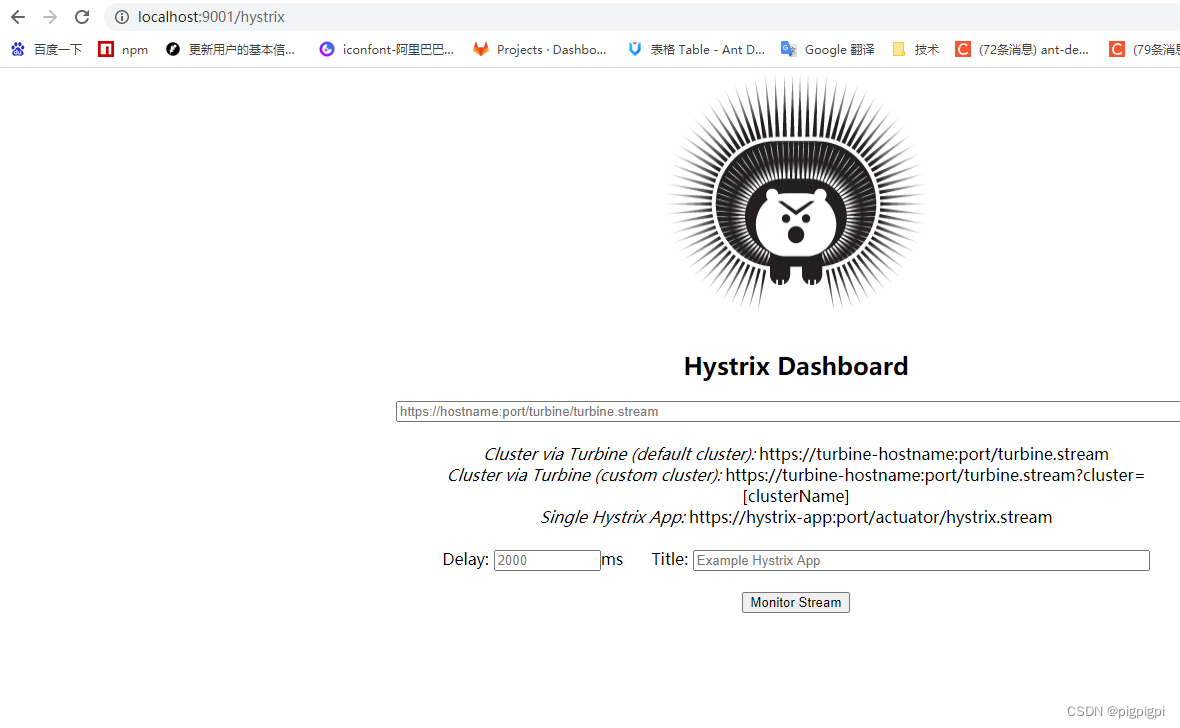
5、启动cloud-consumer-hystrix-dashboard9001
启动cloud-consumer-hystrix-dashboard9001该微服务后续将监控微服务8001 http://localhost:9001/hystrix
三、断路器演示(服务监控hystrixDashboard)
服务监控hystrixDashboard
1、修改hystrix-payment8001
注意:新版本Hystrix需要在主启动类PaymentHystrixMain8001中指定监控路径
package com.atguigu.springcloud;

import com.netflix.hystrix.contrib.metrics.eventstream.HystrixMetricsStreamServlet;
import org.springframework.boot.SpringApplication;
import org.springframework.boot.autoconfigure.SpringBootApplication;
import org.springframework.boot.web.servlet.ServletRegistrationBean;
import org.springframework.cloud.client.circuitbreaker.EnableCircuitBreaker;
import org.springframework.cloud.netflix.eureka.EnableEurekaClient;
import org.springframework.context.annotation.Bean;

@SpringBootApplication
@EnableEurekaClient //注册进euraka
@EnableCircuitBreaker
public class PaymentHystrixMain8001 {
    public static void main(String[] args) {
        SpringApplication.run(PaymentHystrixMain8001.class, args);
    }

    /**
     * 此配置是为了服务监控而配置,与服务容错本身无关,springcloud升级后的坑
     * ServletRegistrationBean因为springboot的默认路径不是"/hystrix.stream",
     * 只要在自己的项目里配置上下面的servlet就可以了
     */
    @Bean
    public ServletRegistrationBean getServlet() {
        HystrixMetricsStreamServlet streamServlet = new HystrixMetricsStreamServlet();
        ServletRegistrationBean registrationBean = new ServletRegistrationBean(streamServlet);
        registrationBean.setLoadOnStartup(1);
        registrationBean.addUrlMappings("/hystrix.stream");
        registrationBean.setName("HystrixMetricsStreamServlet");
        return registrationBean;
    }

}
否则Unable to connect to Command Metric Stream.
2、监控测试
启动1个eureka或者3个eureka集群均可
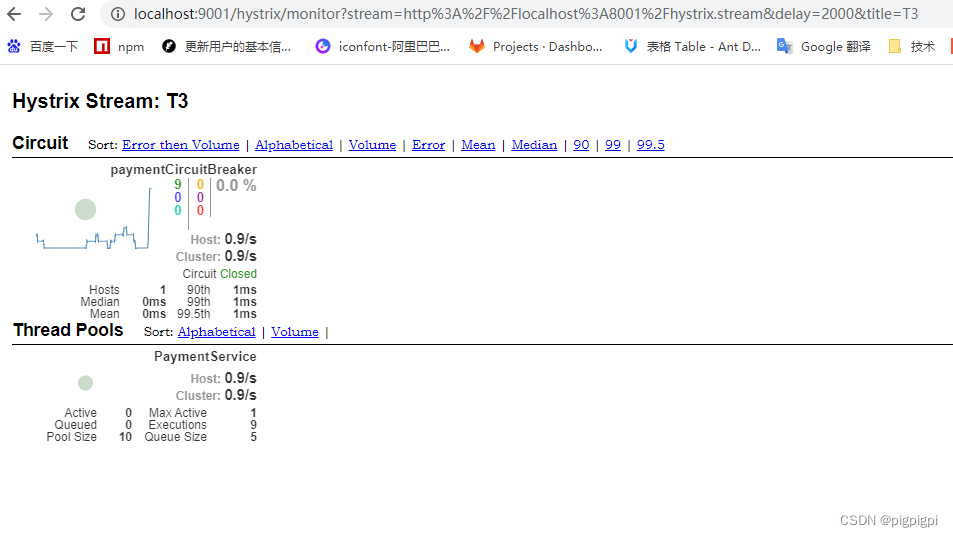
观察监控窗口
9001监控8001,填写监控地址:http://localhost:8001/hystrix.stream
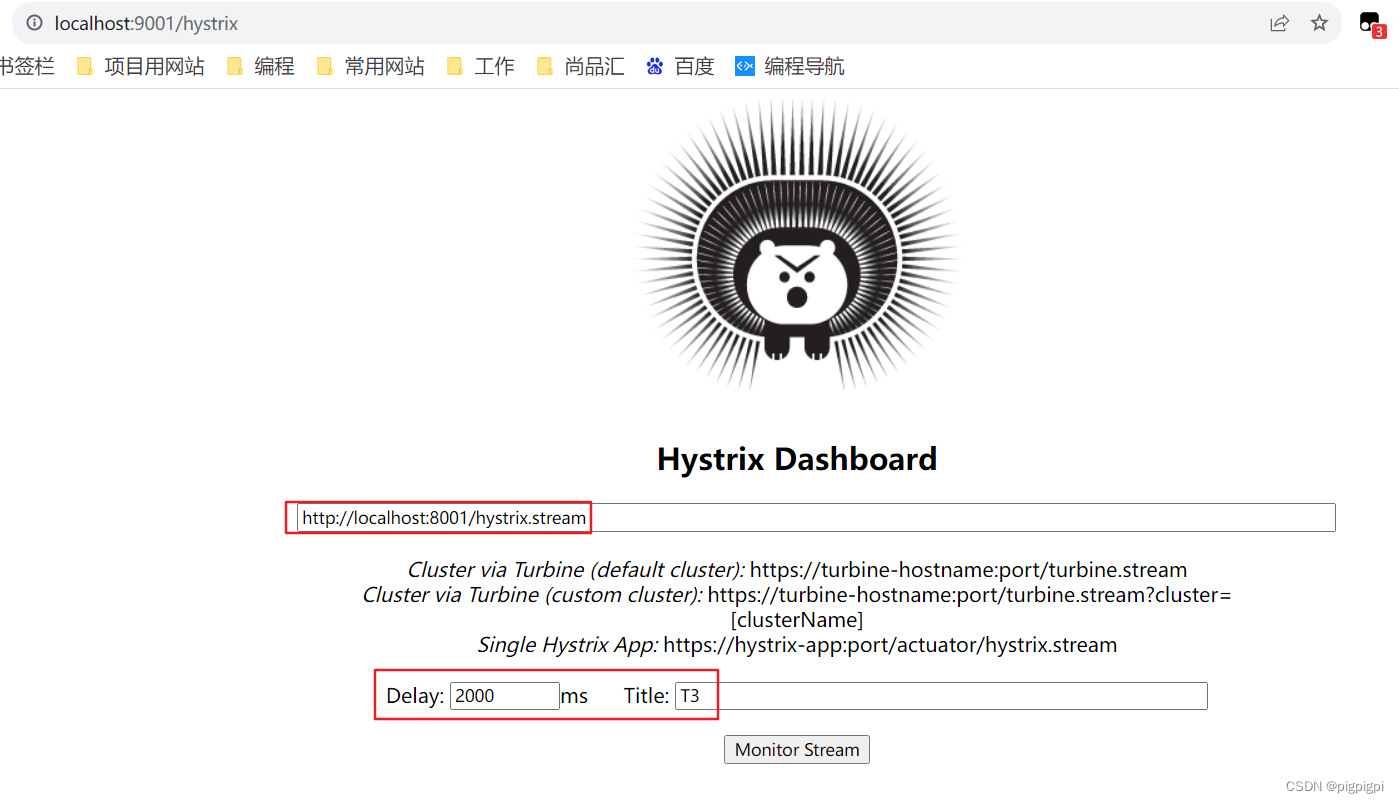
测试地址
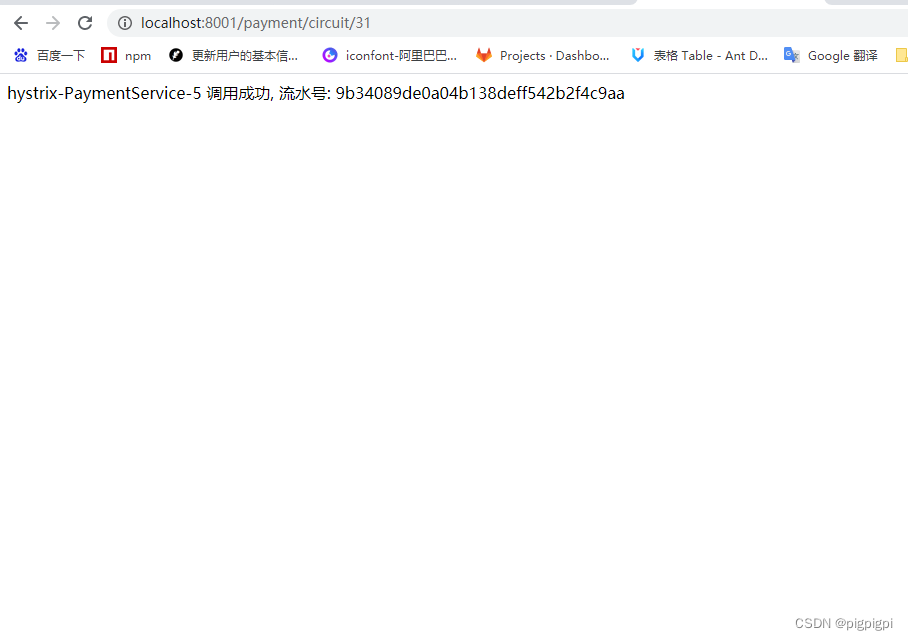
http://localhost:8001/payment/circuit/31
http://localhost:8001/payment/circuit/-31
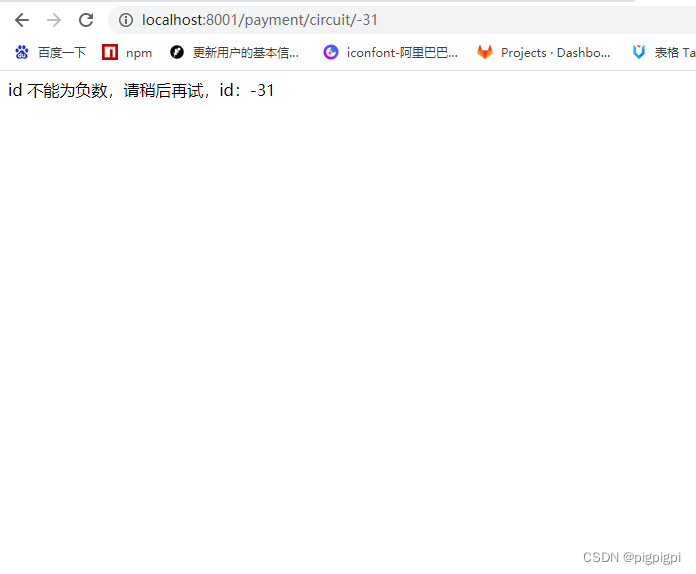
上述测试均通过 ok
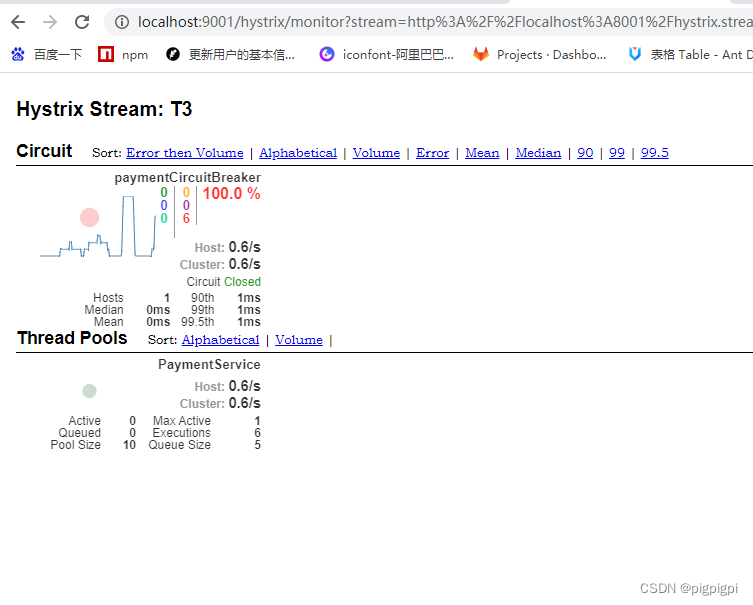
先访问正确地址,再访问错误地址,再正确地址,会发现图示断路器都是慢慢放开的。
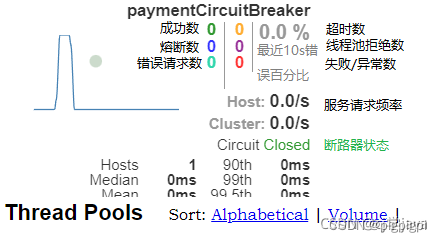
监控结果,成功:
监控结果,失败:
3、如何看
3.1 七色
七色

3.2 一圈
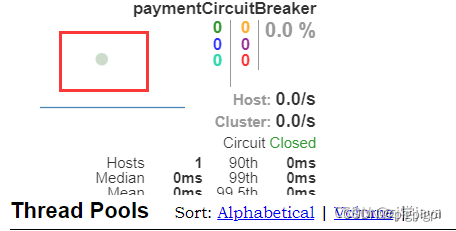
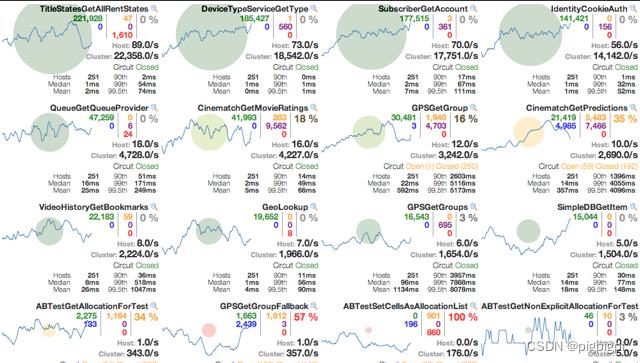
实心圆:共有两种含义。它通过颜色的变化代表了实例的监控程度,它的健康度从绿色<黄色<橙色<红色递减
该实心圆除了颜色变化外,它的大小也会根据实例的请求流量发生变化,流量越大该实心圆就越大。所以通过实心圆的展示,就可以在大量的实例中快速的发现故障实例和高压力实例。
3.3 一线
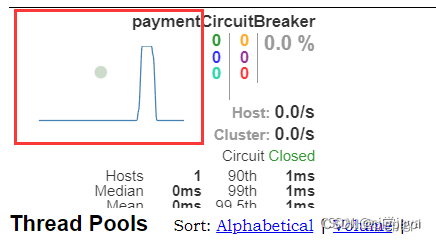
曲线:用来记录2分钟内流量的相对变化,可以通过它来观察到流量的上升和下降趋势。
整图说明:
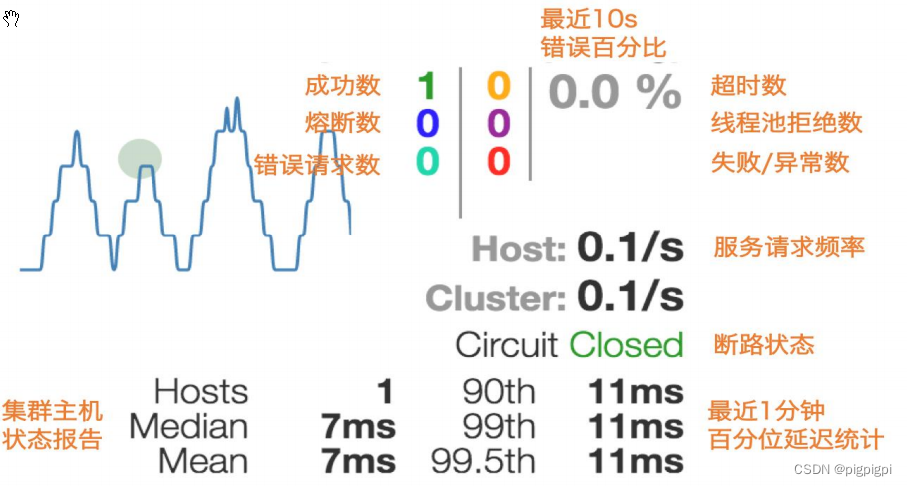
整图说明2:
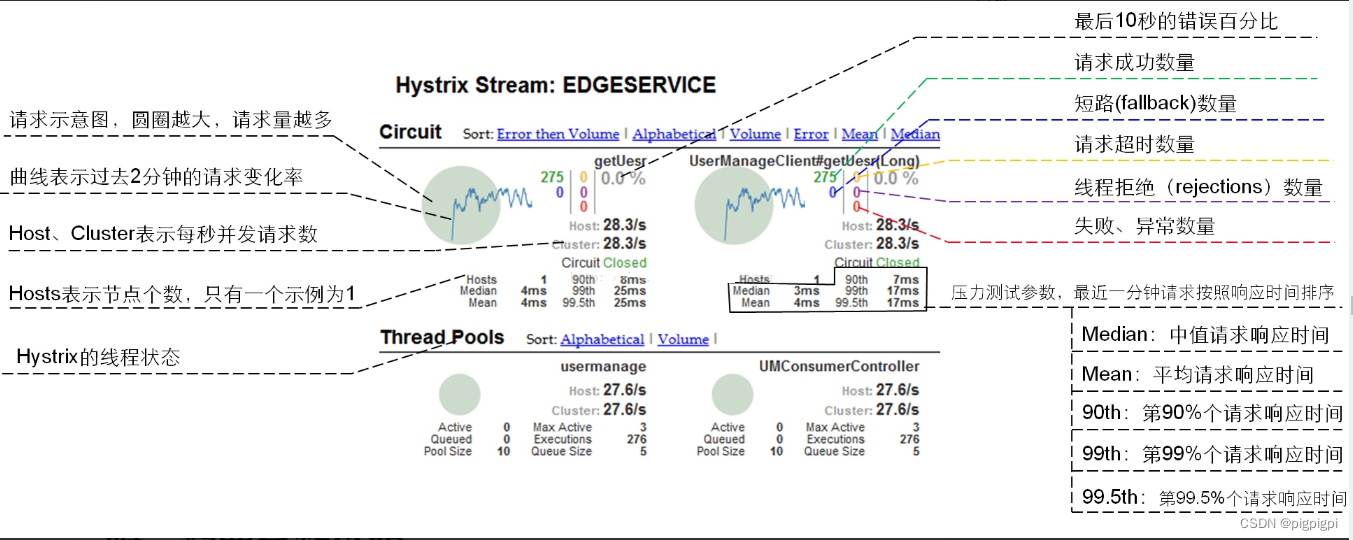
搞懂一个才能看懂复杂的:
3.4 整图说明