先下载echarts
npm install echarts --save在main.js中引入代码
// echarts
import echarts from "echarts";
Vue.prototype.$echarts = echarts;
在template中添加盛放图表的容器,添加ref属性
<template>
  <div ref="myCharts" style:"width:500px;height:300px"></div>
</template>
methods中添加代码,须在页面挂载后调用一次,加载页面
mounted() {
this.initCharts();// dom挂载完毕后调用函数加载echarts图表
},
methods: {
initCharts() {
// 获取并初始化template中添加的容器
const myChart = this.$echarts.init(this.$refs.myCharts);
// 从这往下添加需要添加的echarts图表代码
const option = {
title: {
text: "",
},
tooltip: {
trigger: "axis",
},
legend: {},
toolbox: {
show: true,
feature: {
saveAsImage: {},
},
},
xAxis: {
type: "category",
boundaryGap: false,
data: [
"4月6日",
"4月7日",
"4月8日",
"4月9日",
"4月10日",
"4月11日",
"4月12日",
],
},
yAxis: {
type: "value",
axisLabel: {
formatter: "{value} °C",
},
},
markPoint: {
data: [{ name: "周最低", value: -2, xAxis: 1, yAxis: -1.5 }],
symbolSize: 60,
itemStyle: {
normal: {
color: "pink",
label: {
show: true,
color: "skyblue",
},
},
},
},
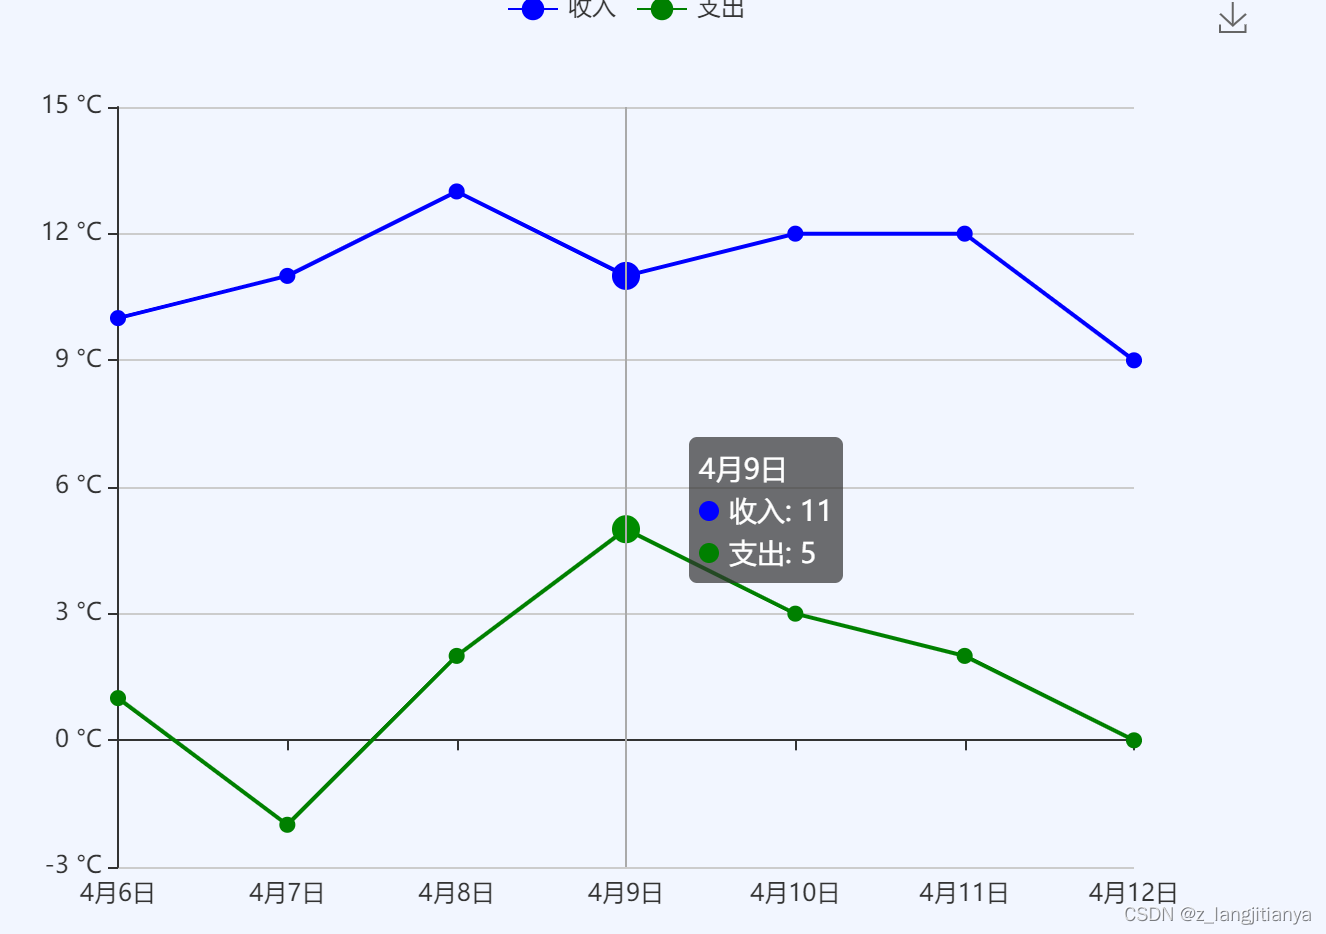
series: [
{
name: "收入",
type: "line",
data: [10, 11, 13, 11, 12, 12, 9],
lineStyle: {
color: "blue",
},
symbol: "circle",
symbolSize: 8,
itemStyle: {
normal: {
color: "blue",
},
},
},
{
name: "支出",
type: "line",
data: [1, -2, 2, 5, 3, 2, 0],
lineStyle: {
color: "green",
},
symbol: "circle",
symbolSize: 8,
itemStyle: {
normal: {
color: "green",
},
},
},
],
};
option && myChart.setOption(option);
},
},效果
版权声明:本文为z_langjitianya原创文章,遵循 CC 4.0 BY-SA 版权协议,转载请附上原文出处链接和本声明。