1 线性回归
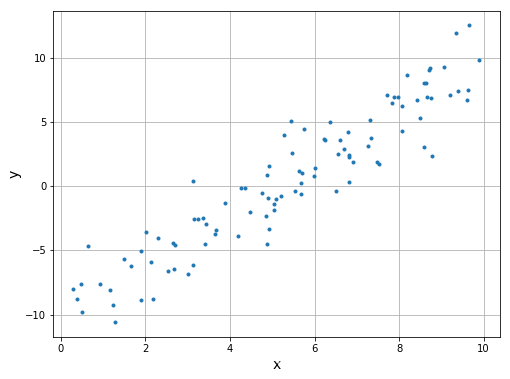
要求:根据data1的二维散点数据,使用最小二乘法(LSM)求解出y关于x线性拟合的最优参数
读取数据:
import numpy as np
import pandas as pd
import matplotlib.pyplot as plt
%matplotlib inline
# 读取data1.csv数据文件
data = pd.read_csv('data1.csv')
# 显示前10行数据
print(data.head(10))
# x,y数据赋值
x, y = data['x'].values, data['y'].values
运行结果如下:
        x       y
0  6.6141  3.5977
1  6.5587  2.4727
2  2.1281 -5.9329
3  3.6540 -3.7233
4  2.7015 -4.6016
5  6.3723  5.0328
6  6.5092 -0.3845
7  7.2615  3.1578
8  2.9964 -6.8540
9  3.6634 -3.3935
画图:
# 二维散点图
plt.figure(figsize=(8,6))
plt.plot(x, y, '.')
plt.xlabel('x', fontsize=14)
plt.ylabel('y', fontsize=14)
plt.grid()
plt.show()

数据维度转换:
**# x增广矩阵(增加一列全1列向量)
x = x.reshape(-1,1)
one_col = np.ones((len(x),1))
x_aug = np.append(x, one_col, axis=1)
print('x_aug:', x_aug.shape)
print(x_aug[:10,:])

# y数据转为二维矩阵
y = y.reshape(-1,1)
print('y:', y.shape)
print(y[:10,:])**
运行结果如下:
x_aug: (100, 2)
[[6.6141 1.    ]
 [6.5587 1.    ]
 [2.1281 1.    ]
 [3.654  1.    ]
 [2.7015 1.    ]
 [6.3723 1.    ]
 [6.5092 1.    ]
 [7.2615 1.    ]
 [2.9964 1.    ]
 [3.6634 1.    ]]
y: (100, 1)
[[ 3.5977]
 [ 2.4727]
 [-5.9329]
 [-3.7233]
 [-4.6016]
 [ 5.0328]
 [-0.3845]
 [ 3.1578]
 [-6.854 ]
 [-3.3935]]
编写基于最小二乘公式法的线性回归模型
# 线性回归模型
# 输入: x,y
# 输出: 最优参数
def linear_regression(x, y):
    dx=np.dot(x.T,x)
    dx=np.linalg.pinv(dx)
    dx=np.dot(dx,x.T)
    dx=np.dot(dx,y)
    return dx
编写均方误差MSE计算函数:
# 均方误差计算函数
# 输入: 线性参数w, x, y
# 输出: 均方误差
def MSE(w, x, y):
    y=y-np.dot(x,w)
    y=y*y
    return np.sum(y)
w = linear_regression(x_aug, y)
输出结果:
print('最优参数w:\n', w)
print('均方误差MSE: {:.6f}'.format(MSE(w, x_aug, y)))

def plot_result(w, x, y):
    xx = np.linspace(x.min()-1, x.max()+1, 100)
    yy = w[0]*xx+w[1]
    plt.figure(figsize=(9,6))
    plt.plot(x, y, '.')
    plt.plot(xx, yy, 'r')
    plt.grid()
    plt.show()

plot_result(w, x, y)
运行结果如下:
最优参数w:
 [[ 1.94697139]
 [-9.97123839]]
均方误差MSE: 368.865389

2 逻辑回归
读取数据:
import numpy as np
import pandas as pd
import matplotlib.pyplot as plt
%matplotlib inline
# 读取data2.csv数据文件
data = pd.read_csv('Data/data2.csv')
# 显示前10行数据
print(data.head(10))
运行结果如下:
         x1         x2  y
0 -0.017612  14.053064  0
1 -1.395634   4.662541  1
2 -0.752157   6.538620  0
3 -1.322371   7.152853  0
4  0.423363  11.054677  0
5  0.406704   7.067335  1
6  0.667394  12.741452  0
7 -2.460150   6.866805  1
8  0.569411   9.548755  0
9 -0.026632  10.427743  0
查看数据维度:
# x,y数据赋值
x, y = data.values[:,:2], data.values[:,2]
print('x.shape:', x.shape)
print('y.shape:', y.shape)
运行结果如下:
x.shape: (100, 2)
y.shape: (100,)
作图:
# 二维散点图
plt.figure(figsize=(8,6))
for i in range(len(y)):
    if(y[i]==0): # 第一类点(绿色圆点)
        plt.scatter(x[i,0], x[i,1], s=30, c='green')
    else: # 第二类点(红色方点)
        plt.scatter(x[i,0], x[i,1], s=30, c='red', marker='s')

plt.grid()

实现sigmoid函数:
# sigmoid函数
def sigmoid(x):
    return 1.0/(1.0+np.exp(-x))
编写逻辑斯谛回归的损失函数:
交叉熵损失函数(Cross-Entropy Loss Function):
# 逻辑斯谛回归损失函数
# 输入:参数w, x, y
# 输出:损失函数值
def loss_function(w, x, y):
    z=np.dot(x,w)
    h=sigmoid(z)
    return (-y*np.log(h)-(1-y)*np.log(1-h)).mean()
编写逻辑斯谛回归模型:
# 逻辑斯谛回归模型
# 输入: x, y, 学习率, 迭代次数, 损失函数记录迭代间隔数
# 输出: 最优参数, 损失函数列表
def logistic_regression(x, y, learning_rate=0.1, num_iter=10000, loss_iter=100):
    N = len(x)

    # x增广矩阵 (增加一列全1列向量)
    one_col = np.ones((N,1))
    x = np.append(x, one_col, axis=1)
    # y数据转为二维矩阵
    y = y.reshape(-1,1)

    # 参数初始化
    w = np.zeros((x.shape[1], 1))
    # loss记录列表
    loss_list = []

    for i in range(num_iter):
        # Sigmoid函数值
        y_hat = sigmoid(np.dot(x, w))

        ''' 请在下方编写计算梯度的代码 '''
        grad_w = np.dot(x.T,(y_hat-y)/y.shape[0])

        # 更新权重
        w = w - learning_rate * grad_w

        # 记录损失函数
        if(i%loss_iter==0):
            loss = loss_function(w, x, y)
            print('Iter: {}, Loss:{:.6f}'.format(i, loss))
            loss_list.append(loss)

    return w, loss_list
参数学习:
# 超参数
learning_rate = 0.001
num_iter = 10000
loss_iter = 100

# 逻辑斯谛回归学习最优参数和损失函数列表
[w, loss_list] = logistic_regression(x, y, learning_rate=learning_rate, num_iter=num_iter, loss_iter=loss_iter)
运行结果如下:
Iter: 0, Loss:0.690212
Iter: 100, Loss:0.599815
Iter: 200, Loss:0.590375
Iter: 300, Loss:0.585724
Iter: 400, Loss:0.581543
Iter: 500, Loss:0.577463
Iter: 600, Loss:0.573444
Iter: 700, Loss:0.569484
……
Iter: 9300, Loss:0.368766
Iter: 9400, Loss:0.367440
Iter: 9500, Loss:0.366128
Iter: 9600, Loss:0.364829
Iter: 9700, Loss:0.363543
Iter: 9800, Loss:0.362270
Iter: 9900, Loss:0.361011
Loss曲线:
plt.figure(figsize=(9,5))
plt.plot(np.linspace(0, num_iter, num_iter//loss_iter), loss_list)
plt.xlabel('Iter')
plt.ylabel('Loss')
plt.grid()
运行结果如下:

查看结果:
print('最优参数w:\n', w)

def plot_result(w, x, y):
    xx = np.linspace(-4,4,100)
    # w[0]*x0 + w[1]*x1 + w[2] = 0
    yy = (-w[2]-w[0]*xx)/w[1]

    plt.figure(figsize=(8,6))
    for i in range(len(y)):
        if(y[i]==0):
            plt.scatter(x[i,0], x[i,1], s=30, c='green')
        else:
            plt.scatter(x[i,0], x[i,1], s=30, c='red', marker='s')
    plt.plot(xx, yy, 'b')
    plt.grid()

plot_result(w, x, y)
运行结果如下:
最优参数w:
 [[ 0.19561443]
 [-0.29046435]
 [ 1.48421566]]

版权声明:本文为Tang_Klay原创文章,遵循 CC 4.0 BY-SA 版权协议,转载请附上原文出处链接和本声明。