matplotlib除了内置单颜色,还有大量colormap颜色,可以理解为多种颜色合在一起的颜色条或者渐变色;
本篇详细介绍matplotlib内置的colormap颜色。
我的公众号:“
pythonic生物人
“,持续分享数据科学和生物信息干货。
版权声明:“pythonic生物人“原创文章,欢迎收藏、点赞、关注三连,转载请标明出处,白嫖是不能原谅的!
写作时间:2020-06-26,有问题可留言或者我的公众号。
目录
1、colormap名称
colormap颜色通过matplotlib的cm模块调用,print(dir(cm))即可输出所有的名称,共计81种(不包含反向色条,例如
‘Reds’的反向色条’Reds_r’),详细如下:
[‘Accent’, ‘Blues’, ‘BrBG’, ‘BuGn’, ‘BuPu’, ‘CMRmap’, ‘Dark2’, ‘GnBu’, ‘Greens’, ‘Greys’, ‘OrRd’, ‘Oranges’, ‘PRGn’, ‘Paired’, ‘Pastel1’, ‘Pastel2’, ‘PiYG’, ‘PuBu’, ‘PuBuGn’, ‘PuOr’, ‘PuRd’, ‘Purples’, ‘RdBu’, ‘RdGy’, ‘RdPu’, ‘RdYlBu’, ‘RdYlGn’, ‘Reds’, ‘Set1’, ‘Set2’, ‘Set3’, ‘Spectral’, ‘Wistia’, ‘YlGn’, ‘YlGnBu’, ‘YlOrBr’, ‘YlOrRd’, ‘afmhot’, ‘autumn’, ‘binary’, ‘bone’, ‘brg’, ‘bwr’, ‘cividis’, ‘cool’, ‘coolwarm’, ‘copper’, ‘cubehelix’, ‘flag’, ‘gist_earth’, ‘gist_gray’, ‘gist_heat’, ‘gist_ncar’, ‘gist_stern’, ‘gist_yarg’, ‘gnuplot’, ‘gnuplot2’, ‘gray’, ‘hot’, ‘hsv’, ‘inferno’, ‘jet’, ‘magma’, ‘nipy_spectral’, ‘ocean’, ‘pink’, ‘plasma’, ‘prism’, ‘rainbow’, ‘seismic’, ‘spring’, ‘summer’, ‘tab10’, ‘tab20’, ‘tab20b’, ‘tab20c’, ‘terrain’, ‘twilight’, ‘twilight_shifted’, ‘viridis’, ‘winter’]
2、 colormap可视化
每个 colormap到底包含哪些颜色了,上图:

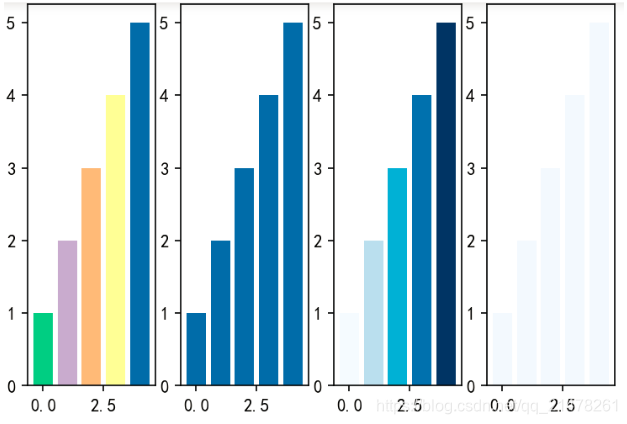
3、colormap使用方法
colormap分ListedColormap(下图中Accent)和LinearSegmentedColormap(下图中Blues)两种,前一种存储特定的颜色(比如说红白黑三种),使用colors可以取出所有的RGBA色号值;后一种可能是渐变色无colors属性。

下面详细介绍怎么使用 colormap。
import matplotlib.pyplot as plt
from matplotlib import cm
plt.figure(dpi=150)
##ListedColormap
#取多种颜色
plt.subplot(1,4,1)
#plt.bar(range(5),range(1,6),color=plt.cm.Accent(range(5)))
#plt.bar(range(5),range(1,6),color=plt.cm.get_cmap(‘Accent’)(range(5)))
plt.bar(range(5),range(1,6),color=plt.get_cmap(‘Accent’)(range(5)))
#取某一种颜色
plt.subplot(1,4,2)
plt.bar(range(5),range(1,6),color=plt.cm.Accent(4))
##LinearSegmentedColormap
#取多种颜色
plt.subplot(1,4,3)
plt.bar(range(5),range(1,6),color=plt.get_cmap(‘Blues’)(np.linspace(0, 1, 5)))
#取一种颜色
plt.subplot(1,4,4)
plt.bar(range(5),range(1,6),color=plt.get_cmap(‘Blues’)(3))
4、参考资料
5、我的公众号
“pythonic生物人”,持续分享数据科学和生物信息干货,欢迎来看看。
