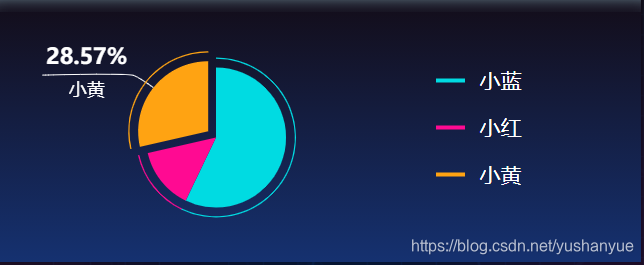
关于Echarts有一圈线的饼图实现-循环高亮-label和labelLine的配置


一.关键代码
//option的配置
 this.option = {
    tooltip: {
      trigger: 'item',
      show: false,
    },
    legend: { show: false},
    series: [
        //饼图
      {
        type: 'pie',
        hoverAnimation: false,//隐藏移入动画
        selectedMode: 'single',//高亮效果
        radius: [0, '56%'],//显示范围
        center: ['45%', '55%'], //图的位置,距离左跟上的
        labelLine: { show: false, },
        label: { show: false, },
        data: this.dataList1
      },
      //边线
      {
        type: 'pie',
        radius: ['63%', '64%'],
        center: ['45%', '55%'],
        hoverAnimation: false,
        selectedMode: 'single',
        labelLine: { show: false, },
        label: { show: false, },
        data: this.dataList
      },
    ]
};
循环高亮-以及指示线的配置
//设置定时器定时循环
this.time = setInterval(() => {
    this.highIndex++
    this.highIndex = this.highIndex >= this.dataLen ? 0 : this.highIndex;
    this.dataList[this.highIndex].selected = true;//高亮外移效果
    this.dataList1[this.highIndex].selected = true;//高亮外移效果
    // 指示文字配置
    this.dataList1[this.highIndex].label = {
      normal: {
        show: true,
        formatter: '{per|{d}%}\n{b|{b}}',//格式
        padding: [0, -90],//位置
        rich: {//样式
          b: {
            color: '#fff',
            fontSize: 18,
            lineHeight: 33,
            align: 'center',
          },
          per: {
            lineHeight: 33,
            fontSize: 22,
            color: '#fff',
            fontWeight: 'bold',
            padding: [25, 0],
            align: 'center'
          }
        },
      },
    };
    //指示线配置
    this.dataList1[this.highIndex].labelLine = {
      normal: {
        show: true,
        lineStyle: {  color: '#fff'   },
        smooth: 0.2,
        length: 20,//第一段线的长度
        length2: 90,//第二段线的长度
      }
    };
    if (this.highIndex == 0) {
      this.dataList[this.dataLen - 1].selected = false;
      this.dataList1[this.dataLen - 1].selected = false;
      if (this.dataList1[this.dataLen - 1].label) {
        this.dataList1[this.dataLen - 1].label.normal.show = false;
        this.dataList1[this.dataLen - 1].labelLine.normal.show = false;
      }
    } else {
      this.dataList[this.highIndex - 1].selected = false;
      this.dataList1[this.highIndex - 1].selected = false;
      if (this.dataList1[this.highIndex - 1].label) {
        this.dataList1[this.highIndex - 1].label.normal.show = false;
        this.dataList1[this.highIndex - 1].labelLine.normal.show = false;
      }
    }
    this.optionInit()//改变数据后重新初始化option
    this.myChart.setOption(this.option);//重新渲染图表
}, 2500)
二.完整代码
1.数据格式
/*
数据结构
        {
          name: "小蓝",
          value: 12,
          itemStyle: { color: "#00dbe2" },
          selected: false
        },
        {
          name: "小红",
          value: 3,
          itemStyle: { color: "#ff0a92" },
          selected: false
        },
        {
          name: "小黄",
          value: 6,
          itemStyle: { color: "#ffa312" },
          selected: false
        },

*/
2.html部分
<template>
  <div class="water-eval-container">
    <div class="con">
      <div class="cityGreenLand-charts" id="cityGreenLand-charts"></div>
    </div>
    <div class="right">
      <div v-for="(item,index) in dataList" :key="index" class="item">
        <div class="left">
          <div class="icon" :style="{background:item.itemStyle.color}"></div>
          <span class="name">{{item.name}}</span>
        </div>
    </div>
    </div>
  </div>
</template>
3.js部分
<script>
import echarts from 'echarts'
export default {
  props: {
    list: Array,
  },
  data() {
    return {
      option: {},
      dataList: JSON.parse(JSON.stringify(this.list)),//边线数据
      dataList1: [],//饼图数据
      dataLen: 0,
      highIndex: 0,
      selectedIndex: '',
      time: null,
      myChart: null,
    }
  },
  watch: {
    list() {
      this.dataList = this.list;
      this.dataLen = this.dataList.length;
      this.dataList1 = JSON.parse(JSON.stringify(this.dataList));
      if (this.dataList.length) this.init()
    }
  },
  beforeDestroy() {
    clearInterval(this.timer);
    this.timer = null;
  },
  methods: {
    //   初始化数据
    optionInit() {
      this.option = {
        tooltip: {
          trigger: 'item',
          show: false,
        },
        legend: {
          show: false,
          data: [],
        },
        grid: {
          left: 0,
          right: 0,
          bottom: 0,
          containLabel: true
        },
        series: [
          {
            name: '访问来源',
            type: 'pie',
            hoverAnimation: false,
            selectedMode: 'single',
            radius: [0, '56%'],
            center: ['45%', '55%'], //图的位置,距离左跟上的
            labelLine: { show: false, },
            label: { show: false, },
            data: this.dataList1
          },
          {
            type: 'pie',
            radius: ['63%', '64%'],
            center: ['45%', '55%'], //图的位置,距离左跟上的
            hoverAnimation: false,
            selectedMode: 'single',
            labelLine: { show: false, },
            label: { show: false, },
            data: this.dataList
          },
        ]
      };
    },
    // 初始化图表
    init() {
      this.myChart = echarts.init(document.getElementById('cityGreenLand-charts'));
      this.optionInit()
      this.myChart.setOption(this.option);
      window.addEventListener('resize', () => {
        this.myChart.resize()
      })
      this.time = setInterval(() => {
        this.highIndex++
        this.highIndex = this.highIndex >= this.dataLen ? 0 : this.highIndex;
        this.dataList[this.highIndex].selected = true;
        this.dataList1[this.highIndex].selected = true;
        // 指示文字
        this.dataList1[this.highIndex].label = {
          normal: {
            show: true,
            formatter: '{per|{d}%}\n{b|{b}}',
            padding: [0, -90],
            rich: {
              b: {
                color: '#fff',
                fontSize: 18,
                lineHeight: 33,
                align: 'center',
              },
              per: {
                lineHeight: 33,
                fontSize: 22,
                color: '#fff',
                fontWeight: 'bold',
                padding: [25, 0],
                align: 'center'
              }
            },
          },
        };
        this.dataList1[this.highIndex].labelLine = {
          normal: {
            show: true,
            lineStyle: {
              color: '#fff'
            },
            smooth: 0.2,
            length: 20,
            length2: 90,
          }
        };
        if (this.highIndex == 0) {
          this.dataList[this.dataLen - 1].selected = false;
          this.dataList1[this.dataLen - 1].selected = false;
          if (this.dataList1[this.dataLen - 1].label) {
            this.dataList1[this.dataLen - 1].label.normal.show = false;
            this.dataList1[this.dataLen - 1].labelLine.normal.show = false;
          }
        } else {
          this.dataList[this.highIndex - 1].selected = false;
          this.dataList1[this.highIndex - 1].selected = false;
          if (this.dataList1[this.highIndex - 1].label) {
            this.dataList1[this.highIndex - 1].label.normal.show = false;
            this.dataList1[this.highIndex - 1].labelLine.normal.show = false;
          }
        }
        this.optionInit()
        this.myChart.setOption(this.option);
      }, 2500)
    }
  }
}
</script>
4.css部分
<style scoped lang="less">
.water-eval-container {
  width: 100%;
  height: 100%;
  position: relative;
  .right {
    position: absolute;
    top: 50%;
    transform: translateY(-50%);
    right: 0;
    width: 32%;
    .item {
      display: flex;
      align-items: center;
      justify-content: space-between;
      margin-bottom: 2rem;
      .left {
        display: flex;
        align-items: center;
      }
      .icon {
        width: 2.9rem;
        height: 0.4rem;
        margin-right: 1.5rem;
      }
      .name {
        font-size: 2.1rem;
        font-family: Source Han Sans CN;
        font-weight: 500;
        color: #ffffff;
      }
    }
  }
  .con {
    height: 100%;
    width: 75%;
    position: absolute;
    bottom: 0%;
    overflow: hidden;
    .cityGreenLand-charts {
      position: absolute;
      left: -0%;
      bottom: 5%;
      z-index: 2;
      height: 100%;
      width: 100%;
      //   transform: scale(1.5);
    }
    .offlineBack {
      position: absolute;
      height: 100%;
      width: 60%;
      bottom: 2%;
      left: 3%;
      z-index: 1;
      transform: rotateZ(0deg);
      background-size: contain;
      overflow: hidden;
      .title {
        position: absolute;
        top: 15%;
        left: 50%;
        transform: translateX(-50%);
        z-index: 5;
        font-size: 2.8rem;
        font-family: Source Han Sans CN;
        font-weight: bold;
        text-shadow: 0 0 8px #fff, 0 0 15px #00c8ff;
        //   font-style: italic;
        color: #ffffff;
        text-align: center;
      }
      //   height: 200px;
      //   animation: round-animate 5s linear infinite;
      img {
        position: absolute;
        bottom: 0;
        left: 0;
        width: 100%;
        height: auto;
      }
    }
  }
}
</style>
版权声明:本文为yushanyue原创文章,遵循 CC 4.0 BY-SA 版权协议,转载请附上原文出处链接和本声明。