最近用echarts
首先就是遇到这个错误
引入官网案例,页面啥都没得。
原来是版本问题5.x版本太高
https://gitcode.net/mirrors/apache/echarts/-/archive/master/echarts.zip
下载压缩包解压后。dist目录下面的echarts.js就可以了
layui整合echart
我看这个老哥整的
https://blog.csdn.net/Mihu_Tutu/article/details/122250670
不会自己整也没关系,我直接把整合的发过来
下载:https://wwec.lanzoum.com/ii5QX0qwnxpa 密码:3bqe
下载后改一下后缀名->echarts.js就可以;
下面是第一个html模板
<!DOCTYPE html>
<html>
<head>
<meta charset="utf-8" />
<title>ECharts</title>
<!-- 引入刚刚下载的 ECharts 文件 -->
<link rel="stylesheet" href="../layui/css/layui.css">
<script src="../layui/layui.js"></script>
</head>
<body>
<div id="EchartZhu" style="width: 100%;height:300px;"></div>
<div id="monitorBing" style="width: 100%;height:300px;"></div>
<div id="monitorZhe" style="width: 100%;height:300px;"></div>
<script>
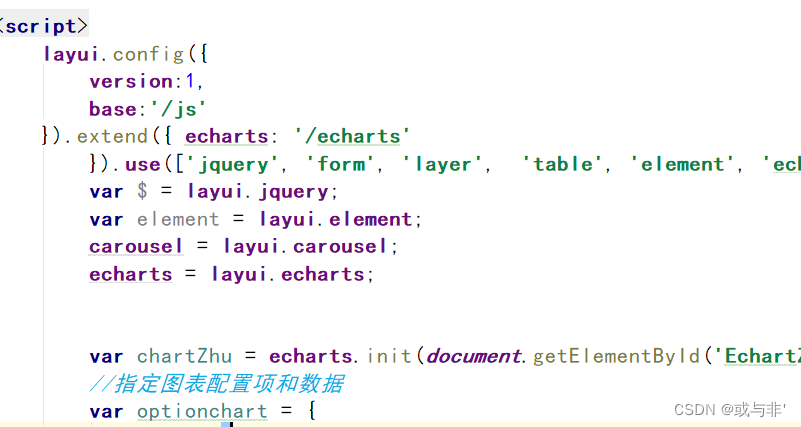
layui.config({
version:1,
base:'/js'
}).extend({ echarts: '/echarts'
}).use(['jquery', 'form', 'layer', 'table', 'element', 'echarts'], function () {
var $ = layui.jquery;
var element = layui.element;
carousel = layui.carousel;
echarts = layui.echarts;
var chartZhu = echarts.init(document.getElementById('EchartZhu'));
//指定图表配置项和数据
var optionchart = {
title: {
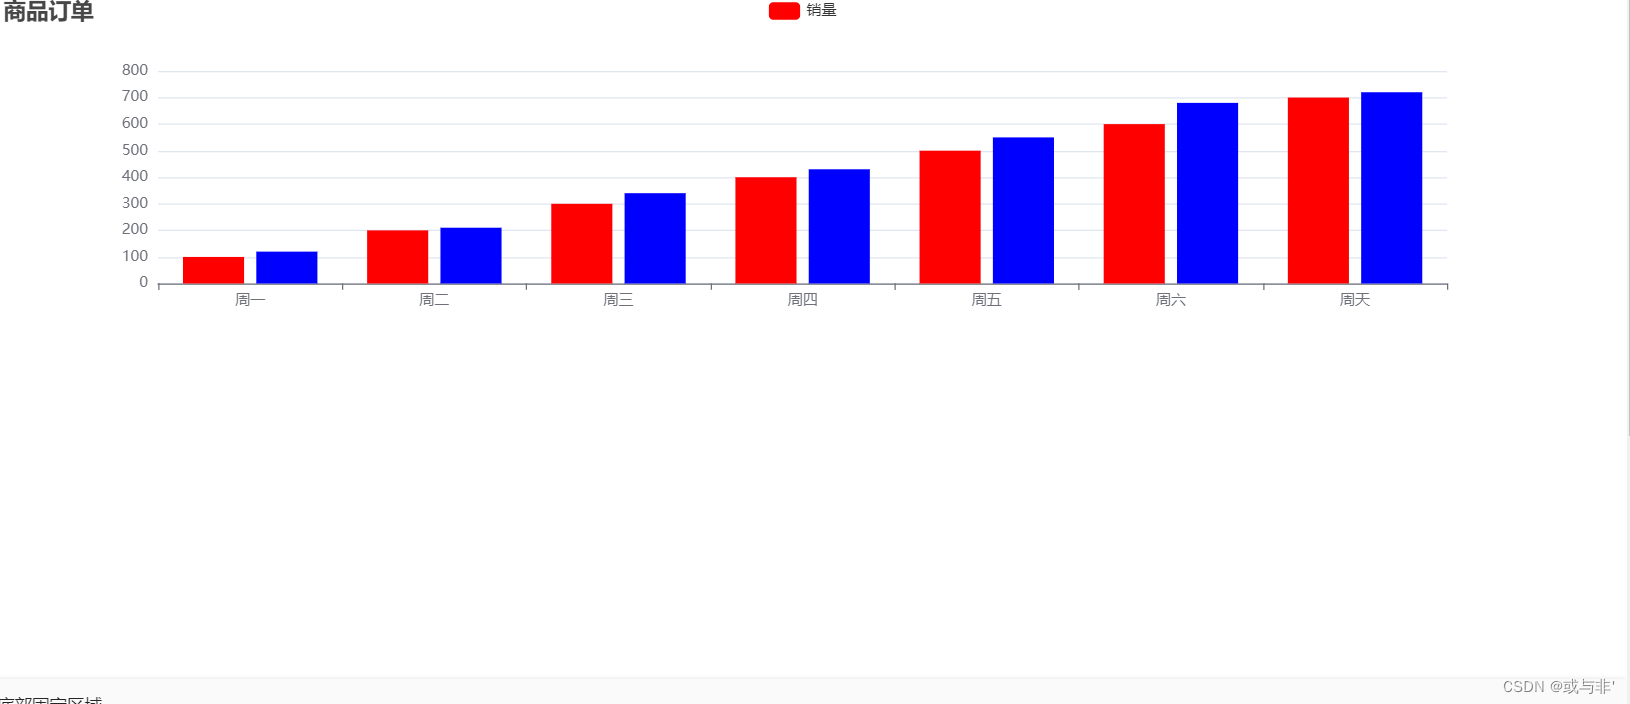
text: '商品订单'
},
tooltip: {},
legend: {
data: ['销量']
},
xAxis: {
data: ['周一', '周二', '周三', '周四', '周五', '周六', '周天']
},
yAxis: {
type: 'value'
},
series: [{
name: '销量',
type: 'bar', //柱状
data: [100,200,300,400,500,600,700],
itemStyle: {
normal: { //柱子颜色
color: 'red'
}
},
},{
name:'产量',
type:'bar',
data:[120,210,340,430,550,680,720],
itemStyle:{
normal:{
color:'blue'
}
}
}]
};
var optionchartZhe = {
title: {
text: '商品订单'
},
tooltip: {},
legend: { //顶部显示 与series中的数据类型的name一致
data: ['销量', '产量', '营业额', '单价']
},
xAxis: {
// type: 'category',
// boundaryGap: false, //从起点开始
data: ['周一', '周二', '周三', '周四', '周五', '周六', '周日']
},
yAxis: {
type: 'value'
},
series: [{
name: '销量',
type: 'line', //线性
data: [145, 230, 701, 734, 1090, 1130, 1120],
}, {
name: '产量',
type: 'line', //线性
data: [720, 832, 801, 834, 1190, 1230, 1220],
}, {
smooth: true, //曲线 默认折线
name: '营业额',
type: 'line', //线性
data: [820, 932, 901, 934, 1290, 1330, 1320],
}, {
smooth: true, //曲线
name: '单价',
type: 'line', //线性
data: [220, 332, 401, 534, 690, 730, 820],
}]
};
var optionchartBing = {
title: {
text: '商品订单',
subtext: '纯属虚构', //副标题
x: 'center' //标题居中
},
tooltip: {
// trigger: 'item' //悬浮显示对比
},
legend: {
orient: 'vertical', //类型垂直,默认水平
left: 'left', //类型区分在左 默认居中
data: ['单价', '总价', '销量', '产量']
},
series: [{
type: 'pie', //饼状
radius: '60%', //圆的大小
center: ['50%', '50%'], //居中
data: [{
value: 335,
name: '单价'
},
{
value: 310,
name: '总价'
},
{
value: 234,
name: '销量'
},
{
value: 135,
name: '产量'
}
]
}]
};
chartZhu.setOption(optionchart, true);
});
</script>
</body>
</html>
做几点说明
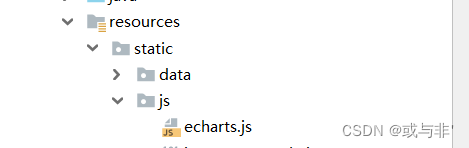
base指的是你的resource/static
所以我的目录是 /js
效果
版权声明:本文为weixin_45907018原创文章,遵循 CC 4.0 BY-SA 版权协议,转载请附上原文出处链接和本声明。