R语言—ggplot图片边缘空白设置
今天,使用ggplot绘图时候,出现x轴label显示不全的问题,当时第一感觉可以使用adobe illustrator调节;反过来又一想,应该是可以设置图片边缘空白空间的。
1. ggplot图片边缘空白问题
数据格式大致如下,两列,其中第一列列名为
ypred
,第二列列名为
yreal
:
>head(fd)
      ypred yreal
V444      3    12
V1421    10    24
V1244    23    36
V205      1    48
V1360    12    60
V225     15    72
使用ggplot2绘图:
require(ggplot2)
ggplot(fd, aes(x=yreal, y=ypred)) +
  geom_point(color = "grey20",size = 1, alpha = 0.8) +
  geom_smooth(formula = y ~ x, color = "red",
  fill = "blue", method = "lm",se = F) +
  theme_bw() +
  labs(x=paste0("Actual rank ","(",loc,")" ), y="Prediction rank")
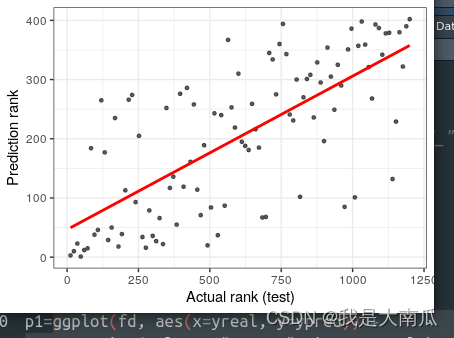
可以看到下图
右下角1250标签
显示不完整,
0
被吃掉半块。

2. 设置ggplot2图片边缘空白区域
查看
默认主题theme_grey
和
theme_bw
主题下边缘区域的距离:
> theme_bw()$plot.margin
[1] 5.5points 5.5points 5.5points 5.5points
> theme_grey()$plot.margin
[1] 5.5points 5.5points 5.5points 5.5points
显然右侧的边缘距离应该加大(使用下面的参数可以解决问题),默认单位为
pt
:
ggplot(fd, aes(x=yreal, y=ypred)) +
  geom_point(color = "grey20",size = 1, alpha = 0.8) +
  geom_smooth(formula = y ~ x, color = "red",
   method = "lm",se = F) +
  theme_bw() +
  labs(x=paste0("Actual rank ","(",loc,")" ), y="Prediction rank")+
  theme(
        plot.margin = margin(t = 20,  # 顶部边缘距离
                             r = 20,  # 右边边缘距离
                             b = 10,  # 底部边缘距离
                             l = 10)) # 左边边缘距离
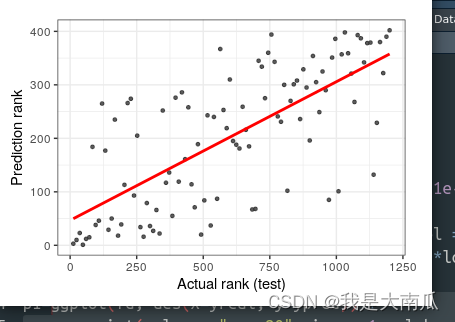
明显看到下侧
xaxis label
显示完整了,问题解决!

Note:这里设置的默认单位是
pt
,也可以制定单位
cm
:
 ggplot( mtcars , aes(x=mpg, y=wt)) +
  geom_point()+
   theme(plot.background = element_rect(color = "red",
                                        size = 3),
         plot.margin = margin(t = 1,  # 顶部边缘距离
                              r = 4,  # 右边边缘距离
                              b = 4,  # 底部边缘距离
                              l = 1,  # 左边边缘距离
                              unit = "cm"))#设置单位为cm
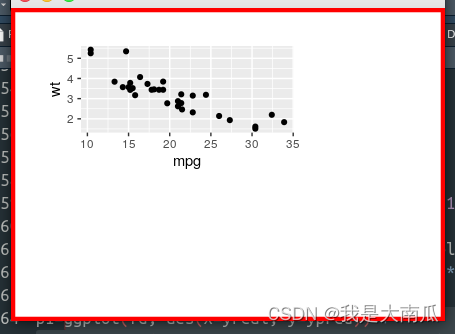
结果如下:

3. ggplot2点图shape映射不能超过6个
问题描述:
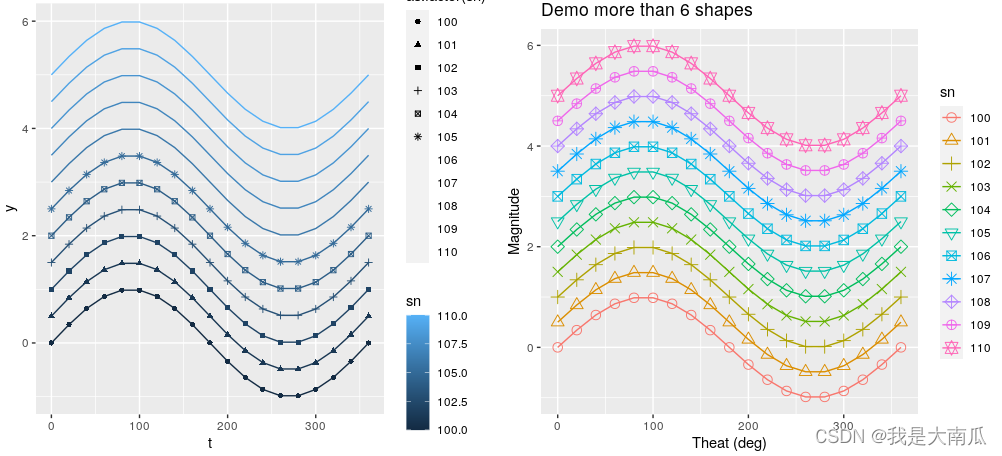
在使用ggplot shape中发现,在aes映射中显示的元素超过6个,会出现报错问题,导致多余元素无法映射:
t=seq(0,360,20)
for (ip in seq(0,10)) {
  if (ip==0) {
    df<-data.frame(t=t,y=sin(t*pi/180)+ip/2,sn=ip+100)
  } else {
    tdf<-data.frame(t=t,y=sin(t*pi/180)+ip/2,sn=ip+100)
    df<-rbind(df,tdf)

  }
}
head(df)
table(df$sn)
100 101 102 103 104 105 106 107 108 109 110
 19  19  19  19  19  19  19  19  19  19  19

gp <- ggplot(df,aes(x=t,y=y,group=sn,color=sn,shape=as.factor(sn)))
gp <- gp + geom_line() + geom_point()
gp
报错信息如下:
Warning messages:
1: The shape palette can deal with a maximum of 6 discrete values because more than 6
becomes difficult to discriminate; you have 11. Consider specifying shapes manually if
you must have them.
2: Removed 95 rows containing missing values (geom_point).
确实查询发现,shape在aes映射中只能最多6个,如果多余6个需要自定义指定:
df$sn <- factor(df$sn)
ggplot(df,aes(x=t, y=y, group=sn,color=sn, shape=sn)) +
             scale_shape_manual(values=1:nlevels(df$sn)) +
             labs(title = "Demo more than 6 shapes", x="Theat (deg)", y="Magnitude") +
             geom_line() +
             geom_point(size=3)

上图,左侧为报错版本图,右侧为自定义设置多个形状图。
以上,结束。
参考:
https://zhuanlan.zhihu.com/p/378406867 (边缘设定)
https://stackoverflow.com/questions/26223857/more-than-six-shapes-in-ggplot (shape设定)