【阿旭机器学习实战】系列文章主要介绍机器学习的各种算法模型及其实战案例,欢迎点赞,关注共同学习交流。
【阿旭机器学习实战】【36】糖尿病预测—决策树建模及其可视化
目录
1. 导入数据并查看数据
关注GZH:
阿旭算法与机器学习
,回复:“
ML36
”即可获取本文数据集、源码与项目文档
# 导入数据包
import pandas as pd
from sklearn.tree import DecisionTreeClassifier
from sklearn.model_selection import train_test_split
from sklearn import metrics
import matplotlib.pyplot as plt
import matplotlib as matplot
import seaborn as sns
%matplotlib inline
col_names = ['pregnant', 'glucose', 'bp', 'skin', 'insulin', 'bmi', 'pedigree', 'age', 'label']
df = pd.read_csv("pima-indians-diabetes.csv", header=None, names=col_names)
df.head()
| pregnant | glucose | bp | skin | insulin | bmi | pedigree | age | label | |
|---|---|---|---|---|---|---|---|---|---|
| 0 | 6 | 148 | 72 | 35 | 0 | 33.6 | 0.627 | 50 | 1 |
| 1 | 1 | 85 | 66 | 29 | 0 | 26.6 | 0.351 | 31 | 0 |
| 2 | 8 | 183 | 64 | 0 | 0 | 23.3 | 0.672 | 32 | 1 |
| 3 | 1 | 89 | 66 | 23 | 94 | 28.1 | 0.167 | 21 | 0 |
| 4 | 0 | 137 | 40 | 35 | 168 | 43.1 | 2.288 | 33 | 1 |
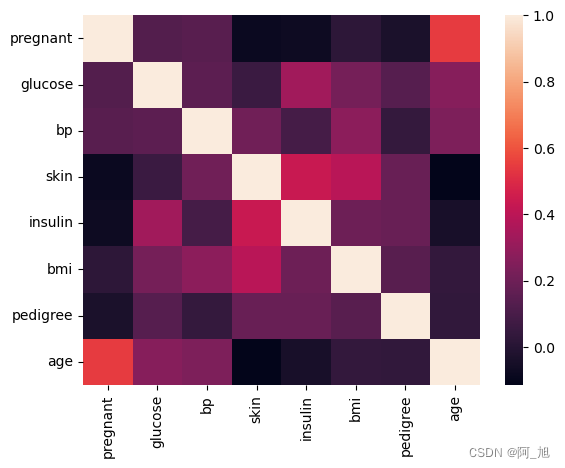
# 相关性矩阵
corr = df.iloc[:,:-1].corr()
#corr = (corr)
sns.heatmap(corr,
            xticklabels=corr.columns.values,
            yticklabels=corr.columns.values)

corr
| pregnant | glucose | bp | skin | insulin | bmi | pedigree | age | |
|---|---|---|---|---|---|---|---|---|
| pregnant | 1.000000 | 0.129459 | 0.141282 | -0.081672 | -0.073535 | 0.017683 | -0.033523 | 0.544341 |
| glucose | 0.129459 | 1.000000 | 0.152590 | 0.057328 | 0.331357 | 0.221071 | 0.137337 | 0.263514 |
| bp | 0.141282 | 0.152590 | 1.000000 | 0.207371 | 0.088933 | 0.281805 | 0.041265 | 0.239528 |
| skin | -0.081672 | 0.057328 | 0.207371 | 1.000000 | 0.436783 | 0.392573 | 0.183928 | -0.113970 |
| insulin | -0.073535 | 0.331357 | 0.088933 | 0.436783 | 1.000000 | 0.197859 | 0.185071 | -0.042163 |
| bmi | 0.017683 | 0.221071 | 0.281805 | 0.392573 | 0.197859 | 1.000000 | 0.140647 | 0.036242 |
| pedigree | -0.033523 | 0.137337 | 0.041265 | 0.183928 | 0.185071 | 0.140647 | 1.000000 | 0.033561 |
| age | 0.544341 | 0.263514 | 0.239528 | -0.113970 | -0.042163 | 0.036242 | 0.033561 | 1.000000 |

2. 训练决策树模型及其可视化
# 选择预测所需的特征
feature_cols = ['pregnant', 'insulin', 'bmi', 'age','glucose','bp','pedigree']
X = pima[feature_cols] # 特征
y = pima.label # 类别标签
# 将数据分为训练和测试数据
X_train, X_test, y_train, y_test = train_test_split(X, y, test_size=0.3, random_state=1) # 70% training and 30% test
2.1 决策树模型
# 创建决策树分类器
clf = DecisionTreeClassifier(criterion='entropy')

# 训练模型
clf = clf.fit(X_train,y_train)

# 使用训练好的模型做预测
y_pred = clf.predict(X_test)
# 模型的准确性
print("Accuracy:",metrics.accuracy_score(y_test, y_pred))
Accuracy: 0.7489177489177489
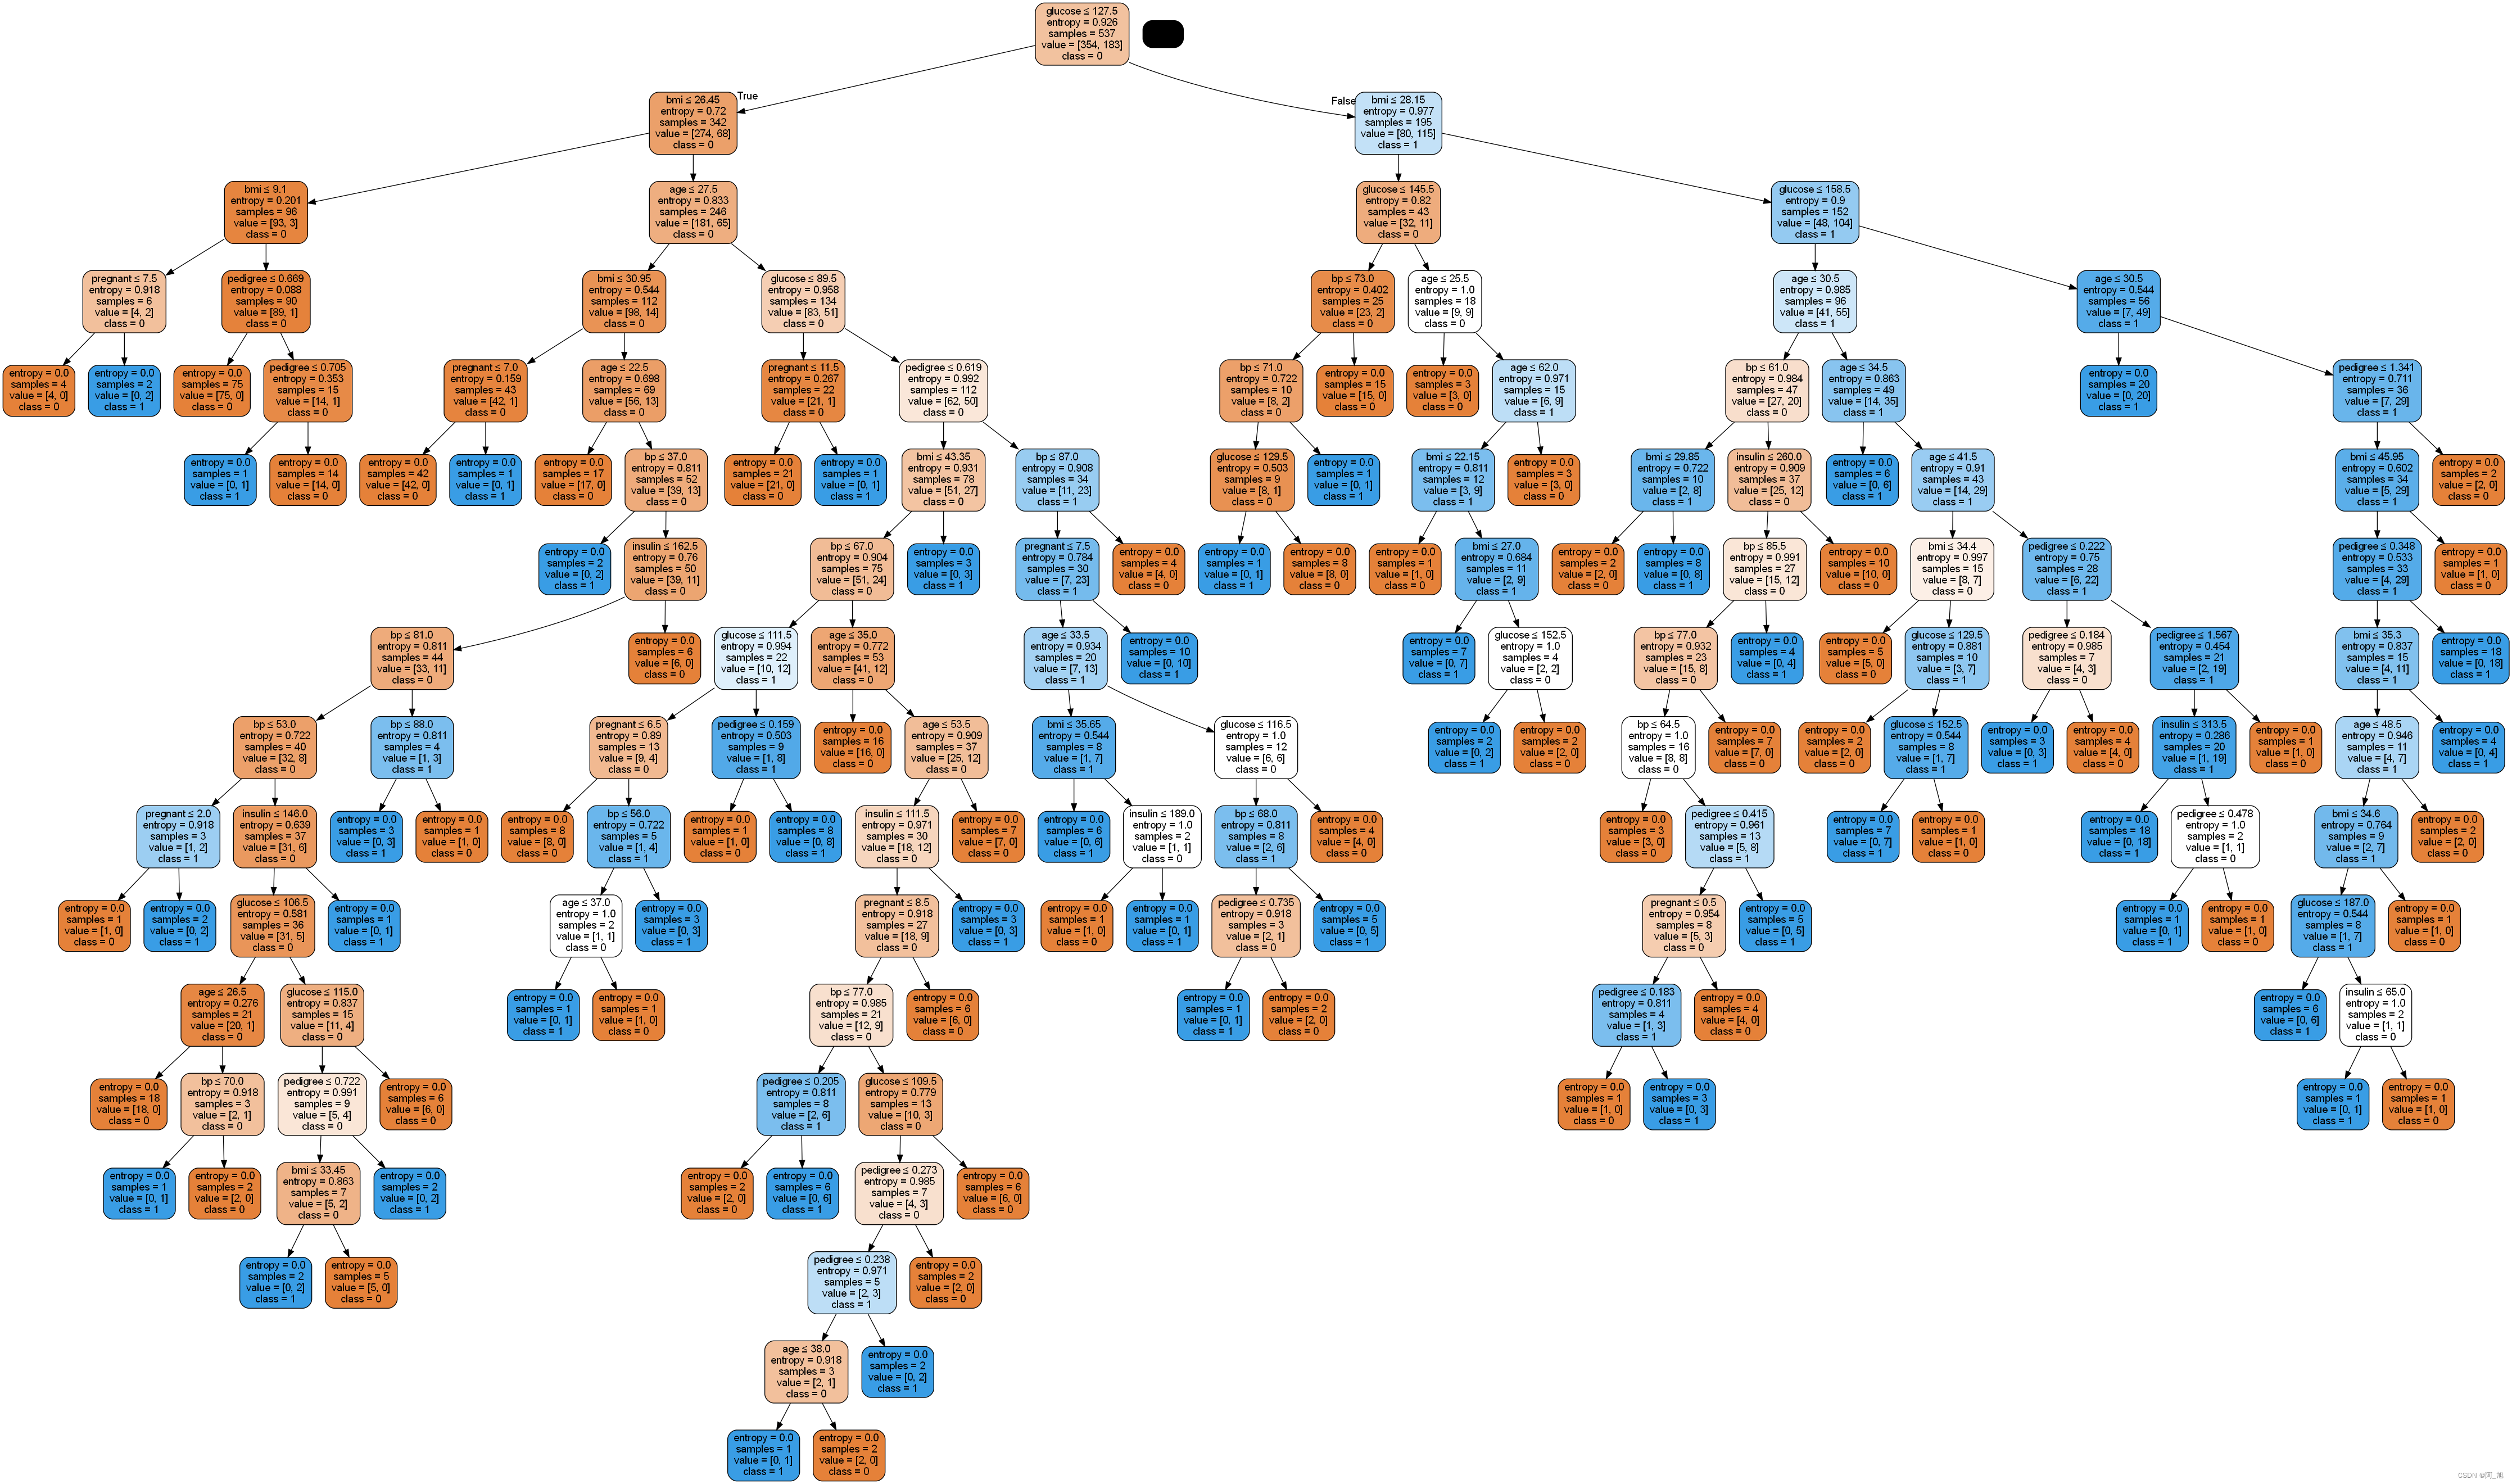
2.2 可视化训练好的决策树模型
注意: 需要使用如下命令安装额外两个包用于画决策树的图
conda install python-graphviz
conda install pydotplus
from sklearn.tree import export_graphviz
from six import StringIO
from IPython.display import Image
import pydotplus
from sklearn import tree

dot_data = StringIO()
export_graphviz(clf, out_file=dot_data,
                filled=True, rounded=True,
                special_characters=True,feature_names = feature_cols,class_names=['0','1'])
graph = pydotplus.graph_from_dot_data(dot_data.getvalue())
graph.write_png('diabetes.png')
Image(graph.create_png())

# 创建新的决策树, 限定树的最大深度, 减少过拟合
clf = tree.DecisionTreeClassifier(
    criterion='entropy',
    max_depth=4, # 定义树的深度, 可以用来防止过拟合
    min_weight_fraction_leaf=0.01 # 定义叶子节点最少需要包含多少个样本(使用百分比表达), 防止过拟合
    )

# 训练模型
clf.fit(X_train,y_train)

# 预测
y_pred = clf.predict(X_test)

# 模型的性能
print("Accuracy:",metrics.accuracy_score(y_test, y_pred))
Accuracy: 0.7705627705627706
from six import StringIO
from IPython.display import Image
from sklearn.tree import export_graphviz
import pydotplus
dot_data = StringIO()
export_graphviz(clf, out_file=dot_data,
                filled=True, rounded=True,
                special_characters=True, feature_names = feature_cols,class_names=['0','1'])
graph = pydotplus.graph_from_dot_data(dot_data.getvalue())
graph.write_png('diabetes2.png')
Image(graph.create_png())

2.2 使用随机森林模型
from sklearn.ensemble import RandomForestClassifier

# 随机森林, 通过调整参数来获取更好的结果
rf = RandomForestClassifier(
    criterion='entropy',
    n_estimators=1,
    max_depth=5, # 定义树的深度, 可以用来防止过拟合
    min_samples_split=10, # 定义至少多少个样本的情况下才继续分叉
    #min_weight_fraction_leaf=0.02 # 定义叶子节点最少需要包含多少个样本(使用百分比表达), 防止过拟合
    )

# 训练模型
rf.fit(X_train, y_train)

# 做预测
y_pred = rf.predict(X_test)

# 模型的准确率
print("Accuracy:",metrics.accuracy_score(y_test, y_pred))
Accuracy: 0.7402597402597403
如果文章对你有帮助,感谢点赞+关注!
关注下方GZH:阿旭算法与机器学习,回复:“ML36”即可获取本文数据集、源码与项目文档,欢迎共同学习交流
版权声明:本文为qq_42589613原创文章,遵循 CC 4.0 BY-SA 版权协议,转载请附上原文出处链接和本声明。