echarts组件使用参考:
https://blog.csdn.net/weixin_50450473/article/details/121510438
目录
图例一:
图例二:
图例三:
图例四:

图例五:

图例六:
图例七:自定义显示内容
图例八:

图例九:
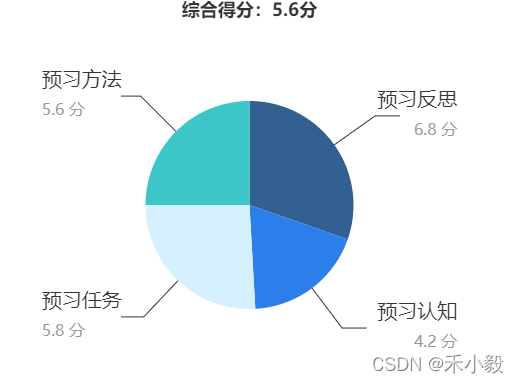
图例一
let datas = [
  { value: 6.8, name: '预习反思' },
  { value: 4.2, name: '预习认知' },
  { value: 5.8, name: '预习任务' },
  { value: 5.6, name: '预习方法' }
];
let sum = 0;
datas.forEach((s) => {
  sum += s.value;
});
let avgNum = (sum / datas.length).toFixed(1);

option = {
  color: ['#326092', '#2c7eeb', '#d5f1ff', '#3dc6c8', '#becae0', '#4d8fc6'],
  title: {
    text: '综合得分:' + avgNum + '分',
    left: 'center'
  },
  grid: {
    top: '0',
    left: '0%',
    right: '0%',
    bottom: '0%',
    containLabel: true
  },
  legend: {
    orient: 'vertical',
    left: 'left',
    show: false
  },
  series: [
    {
      type: 'pie',
      radius: '50%',
      labelLine: {
        length: 50, // 改变标示线的长度
        lineStyle: {
          color: '#333' // 改变标示线的颜色
        }
      },
      label: {
        alignTo: 'edge',
        formatter: '{name|{b}}\n{time|{c} 分}',
        edgeDistance: 10,
        lineHeight: 30,
        fontSize: 20,
        rich: {
          time: {
            fontSize: 16,
            color: '#999'
          }
        },
        textStyle: {
          color: '#333'
        }
      },
      data: datas
    }
  ]
};
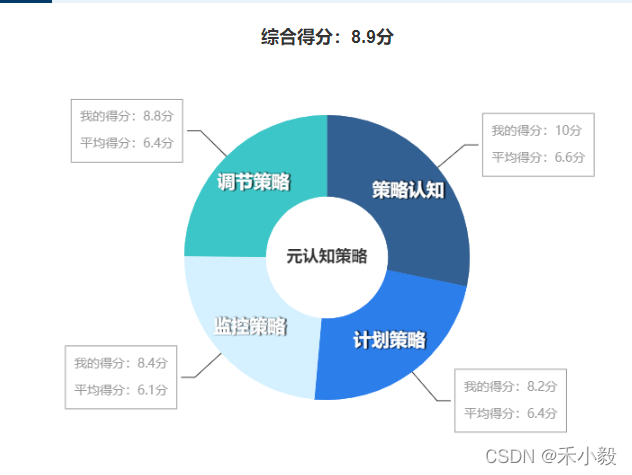
图例二
let datas = [
  { Score: 10, AveScore: 6.6, Name: '策略认知' },
  { Score: 8.2, AveScore: 6.4, Name: '计划策略' },
  { Score: 8.4, AveScore: 6.1, Name: '监控策略' },
  { Score: 8.8, AveScore: 6.4, Name: '调节策略' }
];
let nameList = [];
datas.forEach((fa) => {
  nameList.push({ name: fa.Name, value: fa.Score, ave: fa.AveScore });
});

option = {
  color: ['#326092', '#2c7eeb', '#d5f1ff', '#3dc6c8', '#becae0', '#4d8fc6'],
  title: {
    text: '元认知策略',
    left: 'center',
    top: 'center'
  },
  grid: {
    top: '0',
    left: '0%',
    right: '0%',
    bottom: '0%',
    containLabel: true
  },
  legend: {
    orient: 'vertical',
    left: 'left',
    show: false
  },
  series: [
    {
      type: 'pie',
      radius: ['30%', '70%'],
      label: {
        alignTo: 'edge',
        position: 'inner',
        formatter: '{b}',
        fontSize: 20,
        textStyle: {
          fontWeight: 'bold',
          textShadowColor: '(0,0,0,.1)', // 文字阴影
          textShadowBlur: 1,
          textShadowOffsetX: 1
        }
      },
      data: nameList
    },
    {
      type: 'pie',
      radius: ['30%', '70%'],
      labelLine: {
        length: 40, // 改变标示线的长度
        lineStyle: {
          color: '#333' // 改变标示线的颜色
        }
      },
      label: {
        formatter: function (params) {
          return (
            '我的得分:' +
            params.data.value +
            '分\n平均得分:' +
            params.data.ave +
            '分'
          );
        },
        lineHeight: 30,
        fontSize: 14,
        textStyle: {
          color: '#999',
          borderColor: '#999',
          padding: [5, 10],
          borderWidth: 1
        }
      },
      data: nameList
    }
  ]
};
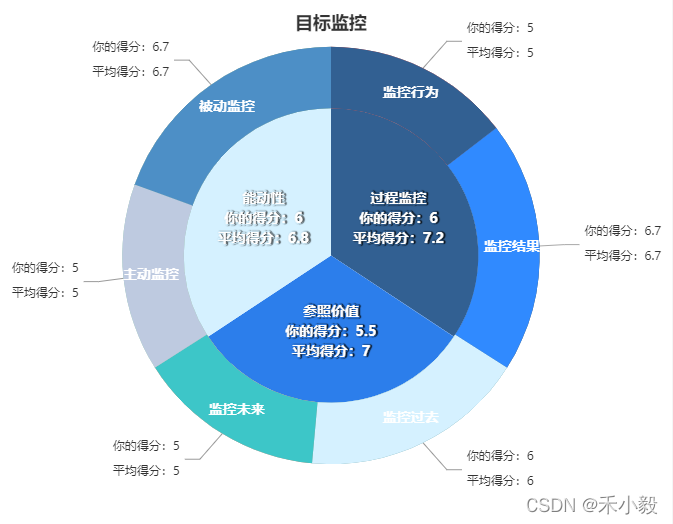
图例三
let datas = [
  {
    Name: '过程监控',
    DivideScore: 7.2,
    UserScore: 6,
    Children: [
      { Name: '监控行为', DivideScore: 5, UserScore: 5 },
      { Name: '监控结果', DivideScore: 6.7, UserScore: 6.7 }
    ]
  },
  {
    Name: '参照价值',
    DivideScore: 7,
    UserScore: 5.5,
    Children: [
      { Name: '监控过去', DivideScore: 5, UserScore: 5 },
      { Name: '监控未来', DivideScore: 6.7, UserScore: 6.7 }
    ]
  },
  {
    Name: '能动性',
    DivideScore: 6.8,
    UserScore: 6,
    Children: [
      { Name: '主动监控', DivideScore: 5, UserScore: 5 },
      { Name: '被动监控', DivideScore: 6.7, UserScore: 6.7 }
    ]
  }
];
let colorList = ['#326092', '#2c7eeb', '#d5f1ff', '#3dc6c8', '#becae0', '#4d8fc6'];
let fatherName = [];
let childName = [];
datas.forEach((ma, index) => {
  fatherName.push({
    name: ma.Name,
    value: ma.UserScore,
    avg: ma.DivideScore
  });
  ma.Children.forEach((chi) => {
    childName.push({
      name: chi.Name,
      value: chi.UserScore,
      avg: chi.DivideScore
    });
  });
});

option = {
  title: {
    text: '目标监控',
    left: 'center'
  },
  series: [
    {
      type: 'pie',
      radius: [0, '60%'],
      itemStyle: {
        normal: {
          label: {
            position: 'inner',
            formatter: function (params) {
              return (
                params.data.name +
                '\n你的得分:' +
                params.data.value +
                '\n平均得分:' +
                params.data.avg
              );
            },
            fontSize: 14,
            lineHeight: 20,
            textStyle: {
              fontWeight: 'bold',
              textShadowColor: '(0,0,0,.1)', // 文字阴影
              textShadowBlur: 1,
              textShadowOffsetX: 1
            }
          },
          // 每个柱子的颜色即为colorList数组里的每一项,如果柱子数目多于colorList的长度,则柱子颜色循环使用该数组
          color: function (params) {
            return colorList[params.dataIndex];
          }
        }
      },
      labelLine: {
        show: false
      },
      data: fatherName
    },
    {
      type: 'pie',
      radius: ['60%', '85%'],
      itemStyle: {
        normal: {
          label: {
            position: 'inner',
            formatter: '{b|{b}}',
            color: '#999',
            rich: {
              b: {
                color: '#fff',
                fontSize: 14,
                fontWeight: 'bold'
              }
            }
          }
        }
      },
      data: childName
    },
    {
      type: 'pie',
      radius: ['60%', '85%'],
      labelLine: {
        length: 30, // 改变标示线的长度
        lineStyle: {
          color: '#999' // 改变标示线的颜色
        }
      },
      itemStyle: {
        normal: {
          label: {
            formatter: function (params) {
              return (
                '你的得分:' +
                params.data.value +
                '\n平均得分:' +
                params.data.value
              );
            },
            color: '#333',
            fontSize: 12,
            lineHeight: 25,
            rich: {
              b: {
                fontSize: 16,
                fontWeight: 'bold'
              },
              c: {
                fontSize: 16
              }
            }
          },
          // 每个柱子的颜色即为colorList数组里的每一项,如果柱子数目多于colorList的长度,则柱子颜色循环使用该数组
          color: function (params) {
            return colorList[params.dataIndex];
          }
        }
      },
      data: childName
    }
  ]
};
图例四
let branch = 32, branchTotal = 146; //科数
let species = 82, speciesTotal = 608; //种数
option = {
  title: [
    {
      text: '占全国湿地维管束植物',
      textStyle: {
        fontSize: 14,
        color: '#333'
      },
      subtext: '总科数',
      subtextStyle: {
        color: '#333',
        fontSize: 14,
        fontWeight: 'bold'
      },
      left: '20%',
      top: '65%',
      textAlign: 'center'
    },
    {
      text: '占全国湿地维管束植物',
      textStyle: {
        fontSize: 14,
        color: '#333'
      },
      subtext: '总种数',
      subtextStyle: {
        color: '#333',
        fontSize: 14,
        align: 'center',
        fontWeight: 'bold'
      },
      left: '70%',
      top: '65%',
      textAlign: 'center'
    }
  ],
  series: [
    {
      name: '总科数',
      type: 'pie',
      hoverAnimation: false,
      radius: ['20%', '25%'],
      center: ['20%', '50%'],
      label: {
        show: false
      },
      data: [
        {
          value: branch,
          name: '总科数',
          label: {
            show: true,
            position: 'center',
            formatter: '{b|{b}}\n{d|{d}}%',
            rich: {
              b: {
                fontSize: 14,
                lineHeight: 30,
                color: '#333'
              },
              d: {
                fontSize: 24,
                color: '#333',
                fontWeight: 'bold'
              }
            },
            color: '#333'
          },
          itemStyle: {
            normal: {
              color: '#1890FF'
            }
          }
        },
        {
          value: branchTotal - branch,
          //不需要显示的数据,颜色设置成和背景一样
          itemStyle: {
            normal: {
              color: '#F0F2F5'
            }
          }
        }
      ]
    },
    {
      name: '总种数',
      type: 'pie',
      hoverAnimation: false,
      radius: ['20%', '25%'],
      center: ['70%', '50%'],
      label: {
        show: false
      },
      data: [
        {
          value: species, //需要显示的数据
          name: '总种数',
          label: {
            show: true,
            position: 'center',
            formatter: '{b|{b}}\n{d|{d}}%',
            rich: {
              b: {
                fontSize: 14,
                lineHeight: 30,
                color: '#333'
              },
              d: {
                fontSize: 24,
                color: '#333',
                fontWeight: 'bold'
              }
            },
            color: '#333'
          },
          itemStyle: {
            normal: {
              color: '#FAFA14'
            }
          }
        },
        {
          value: speciesTotal - species,
          //不需要显示的数据,颜色设置成和背景一样
          itemStyle: {
            normal: {
              color: '#F0F2F5'
            }
          }
        }
      ]
    }
  ]
};
图例五
option = {
  tooltip: {
    trigger: 'item',
    formatter: '{a} <br/>{b}: {c} ({d}%)'
  },
  legend: {
    orient: 'vertical',
    right: '5%',
    top: '20%',
    icon: 'circle',
    textStyle: {
      color: '#333',
      fontSize: 20
    },
    data: ['防火四级', '防火三级', '防火二级', '防火一级']
  },
  series: [
    {
      name: '火险等级',
      type: 'pie',
      radius: ['50%', '70%'],
      avoidLabelOverlap: false,
      label: {
        show: true,
        position: 'center',
        color: '#333'
      },
      emphasis: {
        label: {
          show: true,
          fontSize: 20,
          fontWeight: 'bold'
        }
      },
      labelLine: {
        show: false
      },
      data: [
        {
          value: 50,
          name: '防火一级',
          itemStyle: {
            normal: {
              color: 'rgba(53,130,247,0.6)',
              borderColor: 'rgba(53,130,247,0.8)',
              borderWidth: 3,
              shadowColor: 'rgba(53,130,247,0.8)',
              shadowBlur: 10
            }
          }
        },
        {
          value: 30,
          name: '防火二级',
          itemStyle: {
            normal: {
              color: 'rgba(244,201,7,0.5)',
              borderColor: 'rgba(244,201,7,0.8)',
              borderWidth: 3,
              shadowColor: 'rgba(244,201,7,0.8)',
              shadowBlur: 10
            }
          }
        },
        {
          value: 20,
          name: '防火三级',
          itemStyle: {
            normal: {
              color: 'rgba(25,236,176,0.5)',
              borderColor: 'rgba(25,236,176,0.8)',
              borderWidth: 3,
              shadowColor: 'rgba(25,236,176,0.8)',
              shadowBlur: 10
            }
          }
        },
        {
          value: 10,
          name: '防火四级',
          itemStyle: {
            normal: {
              color: 'rgba(134,66,255,0.6)',
              borderColor: 'rgba(134,66,255,0.8)',
              borderWidth: 3,
              shadowColor: 'rgba(134,66,255,0.8)',
              shadowBlur: 10
            }
          }
        }
      ],
      center: ['35%', '50%']
    }
  ]
};
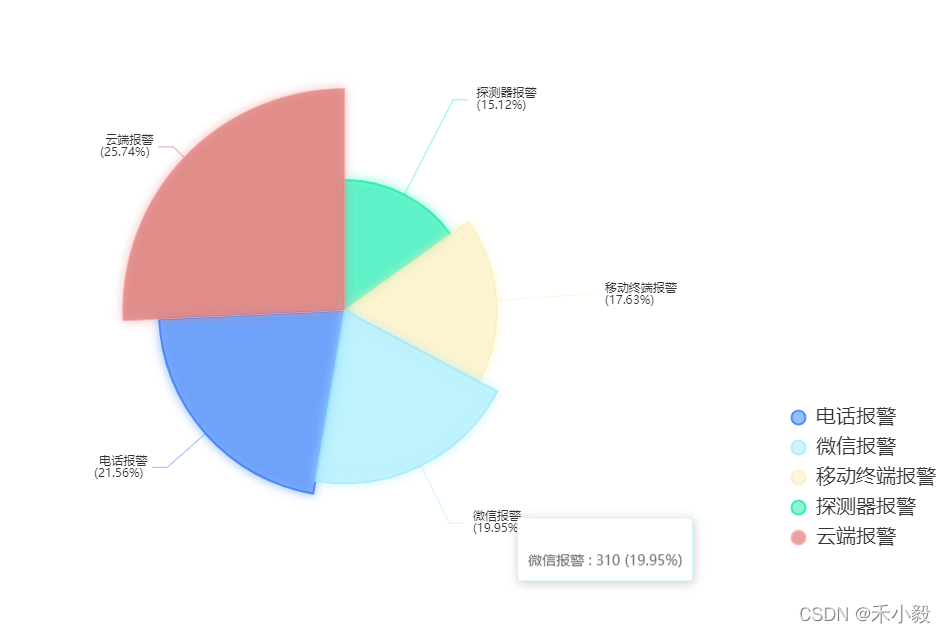
图例六
option = {
  tooltip: {
    trigger: 'item',
    formatter: '{a} <br/>{b} : {c} ({d}%)'
  },
  legend: {
    bottom: '20%',
    icon: 'circle',
    orient: 'vertical',
    left: '75%',
    textStyle: {
      color: '#333',
      fontSize: 20
    },
    data: ['电话报警', '微信报警', '移动终端报警', '探测器报警', '云端报警']
  },
  visualMap: {
    show: false,
    min: 80,
    max: 600,
    inRange: {
      colorLightness: [0, 1]
    }
  },
  series: [
    {
      name: '',
      type: 'pie',
      radius: '55%',
      center: ['35%', '50%'],
      data: [
        {
          value: 335,
          name: '电话报警',
          itemStyle: {
            normal: {
              color: 'rgba(50,123,250,0.5)',
              borderColor: 'rgba(50,123,250,0.8)',
              borderWidth: 2,
              shadowColor: 'rgba(50,123,250,0.8)',
              shadowBlur: 10
            }
          }
        },
        {
          value: 310,
          name: '微信报警',
          itemStyle: {
            normal: {
              color: 'rgba(160,234,253,0.5)',
              borderColor: 'rgba(160,234,253,0.8)',
              borderWidth: 2,
              shadowColor: 'rgba(160,234,253,0.8)',
              shadowBlur: 10
            }
          }
        },
        {
          value: 274,
          name: '移动终端报警',
          itemStyle: {
            normal: {
              color: 'rgba(252,238,187,0.5)',
              borderColor: 'rgba(252,238,187,0.8)',
              borderWidth: 2,
              shadowColor: 'rgba(252,238,187,0.8)',
              shadowBlur: 10
            }
          }
        },
        {
          value: 235,
          name: '探测器报警',
          itemStyle: {
            normal: {
              color: 'rgba(25,236,176,0.5)',
              borderColor: 'rgba(25,236,176,0.8)',
              borderWidth: 2,
              shadowColor: 'rgba(25,236,176,0.8)',
              shadowBlur: 10
            }
          }
        },
        {
          value: 400,
          name: '云端报警',
          itemStyle: {
            normal: {
              color: 'rgba(215,102,98,0.6)',
              borderColor: 'rgba(255,169,166,0.8)',
              borderWidth: 1,
              shadowColor: 'rgba(215,102,98,0.6)',
              shadowBlur: 10
            }
          }
        }
      ].sort(function (a, b) {
        return a.value - b.value;
      }),
      roseType: 'radius',
      label: {
        formatter: '{a} {b}\n ({d}%) '
      },
      itemStyle: {
        shadowBlur: 200,
        shadowColor: 'rgba(0, 0, 0, 0.5)'
      },

      animationType: 'scale',
      animationEasing: 'elasticOut',
      animationDelay: function (idx) {
        return Math.random() * 200;
      }
    }
  ]
};
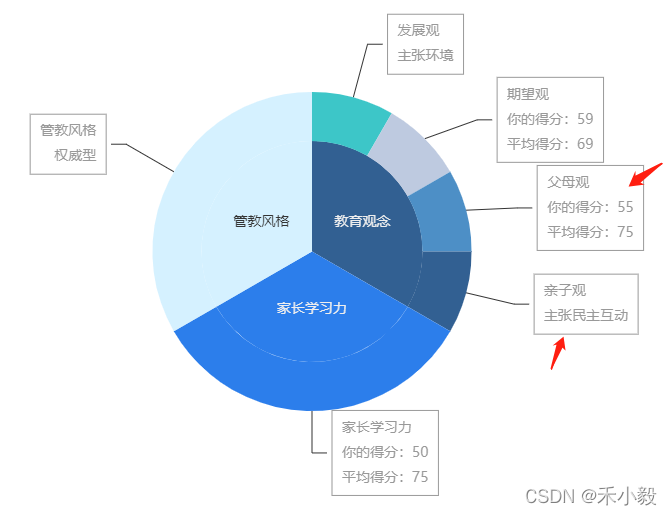
图例七
let datas = [
  {
    Name: '教育观念',
    Title: '',
    Score: null,
    SumAvgScore: null,
    Children: [
      { Score: 0.0, SumAvgScore: 0.0, Name: '发展观', Title: '主张环境' },
      { Score: 69.0, SumAvgScore: 69.0, Name: '期望观' },
      { Score: 70.0, SumAvgScore: 75.0, Name: '父母观' },
      { Score: 0.0, SumAvgScore: 0.0, Name: '亲子观', Title: '主张奖励' }
    ]
  },
  {
    Name: '家长学习力',
    Title: '',
    Score: null,
    SumAvgScore: null,
    Children: [{ Score: 31.0, SumAvgScore: 75.0 }]
  },
  {
    Name: '管教风格',
    Title: '',
    Score: null,
    SumAvgScore: null,
    Children: [
      { Score: 0.0, SumAvgScore: 0.0, Title: '专制型', Name: '您的管教风格:' }
    ]
  }
];
let fatherName = [];
let childName = [];
datas.forEach((ma, index) => {
  if (ma.Name === '教育观念') {
    ma.Children.map((m) => {
      childName.push({
        name: m.Name,
        value: 1,
        SumAvgScore: m.SumAvgScore,
        Score: m.Score,
        Title: m.Title
      });
    });
  } else {
    ma.Children.map((m) => {
      childName.push({
        name: ma.Name,
        value: 4,
        SumAvgScore: m.SumAvgScore,
        Score: m.Score,
        Title: m.Title
      });
    });
  }
  fatherName.push({
    name: ma.Name,
    value: 1,
    SumAvgScore: ma.SumAvgScore
  });
});
option = {
  color: ['#326092', '#2c7eeb', '#d5f1ff', '#3dc6c8', '#becae0', '#4d8fc6'],
  series: [
    {
      type: 'pie',
      selectedMode: 'single',
      radius: [0, '45%'],
      label: {
        position: 'inner',
        fontSize: 14
      },
      labelLine: {
        show: false
      },
      data: fatherName
    },
    {
      type: 'pie',
      radius: ['45%', '65%'],
      labelLine: {
        length: 55, // 改变标示线的长度
        lineStyle: {
          color: '#333' // 改变标示线的颜色
        }
      },
      label: {
        formatter: function (params) {
          if (params.data.Title) {
            return params.data.name + '\n' + params.data.Title;
          } else {
            return (
              params.data.name +
              '\n你的得分:' +
              params.data.Score +
              '\n平均得分:' +
              params.data.SumAvgScore
            );
          }
        },
        lineHeight: 25,
        fontSize: 14,
        textStyle: {
          color: '#999',
          borderColor: '#999',
          padding: [5, 10],
          borderWidth: 1
        },
        rich: {
          b: {
            color: '#4C5058',
            fontSize: 14,
            fontWeight: 'bold',
            lineHeight: 33
          }
        }
      },
      data: childName
    }
  ]
};
图例八
let branchTotal = 100;
let press = 30;
let colorType = 0;
option = {
  backgroundColor: '#000',
  series: [
    {
      type: 'pie',
      clockwise: false, // 逆时针
      hoverAnimation: false,
      radius: ['80%', '100%'],
      label: {
        show: false
      },
      itemStyle: {
        color: function (params) {
          let colorList1 = ['#47C9E5', '#47E4E5'];
          let colorList2 = ['#832BF3', '#2B8EF3'];
          return new echarts.graphic.LinearGradient(0, 0, 0.5, 1, [
            { offset: 0, color: colorList1[colorType] },
            { offset: 1, color: colorList2[colorType] }
          ]);
        },
        borderRadius: 0, // 设置所有圆角
        // barBorderRadius: [50, 50, 0, 0]
      },
      data: [
        {
          value: press,
          label: {
            show: true,
            position: 'center',
            formatter: '{d|{d}}%',
            rich: {
              d: {
                fontSize: 12,
                color: '#fff'
              }
            },
            color: '#fff'
          },
          itemStyle: {
            borderRadius: 0, // 设置当前单个占比圆角
            shadowColor: '#2a2a34'
          }
        },
        {
          value: branchTotal - press,
          //不需要显示的数据,颜色设置成和背景一样
          itemStyle: {
            normal: {
              color: '#525252'
            }
          }
        }
      ]
    }
  ]
};
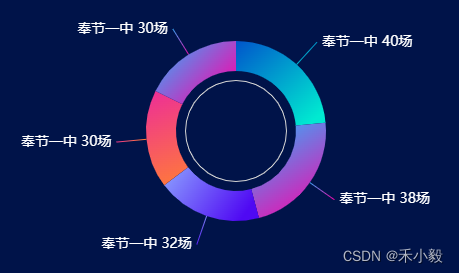
图例九
option = {
  backgroundColor: '#333',
  series: [
    {
      type: 'pie',
      radius: [60, 90],
      center: ['50%', '50%'],
      itemStyle: {
        color: function (params) {
          let colorList1 = ['#0055CB', '#27B7FF', '#8CA2FF', '#ED2D98', '#27B7FF', '#ED2D98','#0055CB','#8CA2FF',];
          let colorList2 = ['#00EAD1', '#F408AB', '#4F09F3', '#FF793B', '#F408AB', '#FF793B','#00EAD1','#4F09F3',];
          return new echarts.graphic.LinearGradient(0, 0, 0.8, 1, [
            { offset: 0, color: colorList1[params.dataIndex] },
            { offset: 1, color: colorList2[params.dataIndex] }
          ]);
        },
        barBorderRadius: [50, 50, 0, 0] // 统一设置四个角的圆角大小
      },
      label: {
        normal: {
          show: true,
          color: '#fff',
          fontSize: 14,
          formatter: function (params) {
            return params.data.Name + ' ' + params.data.value + '场';
          }
        }
      },
      labelLine: {
        length: 30,
        color: '#fff',
        length2: 0
      },
      data: [
        { value: 40, name: '1', Name: '奉节一中' },
        { value: 38, name: '2', Name: '奉节一中' },
        { value: 32, name: '3', Name: '奉节一中' },
        { value: 30, name: '4', Name: '奉节一中' },
        { value: 30, name: '5', Name: '奉节一中' }
      ]
    },
    {
      type: 'pie',
      radius: [50, 51]
    }
  ]
};
希望我的愚见能够帮助你哦~,若有不足之处,还望指出,你们有更好的解决方法,欢迎大家在评论区下方留言支持,大家一起相互学习参考呀~
版权声明:本文为weixin_50450473原创文章,遵循 CC 4.0 BY-SA 版权协议,转载请附上原文出处链接和本声明。