一:绘制单子图
%matplotlib inline
import matplotlib.pyplot as plt
ax_one = plt.subplot(326)
ax_one.plot([1, 2, 3, 4, 5])
ax_two = plt.subplot(312)
ax_two.plot([1, 2, 3, 4, 5])
plt.title(2020080603049)
plt.show()

二:销售分析
%matplotlib inline
import numpy as np
import matplotlib.pyplot as plt
plt.rcParams['font.sans-serif'] = ["SimHei"]
x = [x for x in range(1, 13)]
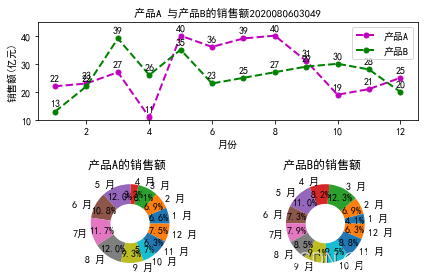
y1 = [22, 23, 27, 11, 40, 36, 39, 40, 31, 19, 21, 25]
y2 = [13, 22, 39, 26, 35, 23, 25, 27, 29, 30, 28, 20]
labels = ['1 月', '2 月', '3 月', '4 月', '5 月', '6 月', '7月', '8 月', '9 月', '10 月', '11 月', '12 月']
ax1 = plt.subplot(211)
ax1.plot(x, y1, 'm--o', lw=2, ms=5, label='产品A')
ax1.plot(x, y2, 'g--o', lw=2, ms=5, label='产品B')
ax1.set_title("产品A 与产品B的销售额2020080603049", fontsize=11)
ax1.set_ylim(10, 45)
ax1.set_ylabel('销售额(亿元)')
ax1.set_xlabel('月份')
for xy1 in zip(x, y1):
ax1.annotate("%s" % xy1[1], xy=xy1, xytext=(-5, 5), textcoords='offset points')
for xy2 in zip(x, y2):
ax1.annotate("%s" % xy2[1], xy=xy2, xytext=(-5, 5), textcoords='offset points')
ax1.legend()
ax2 = plt.subplot(223)
ax2.pie(y1, radius=1, wedgeprops={
'width':0.5}, labels=labels, autopct='%3.1f%%', pctdistance=0.75)
ax2.set_title('产品A的销售额 ')
ax3 = plt.subplot(224)
ax3.pie(y2, radius=1, wedgeprops={
'width':0.5}, labels=labels,autopct='%3.1f%%', pctdistance=0.75)
ax3.set_title('产品B的销售额 ')
plt.tight_layout()
plt.show()
三:绘制多子图
%matplotlib inline
import matplotlib.pyplot as pl
版权声明:本文为qq_55680233原创文章,遵循 CC 4.0 BY-SA 版权协议,转载请附上原文出处链接和本声明。