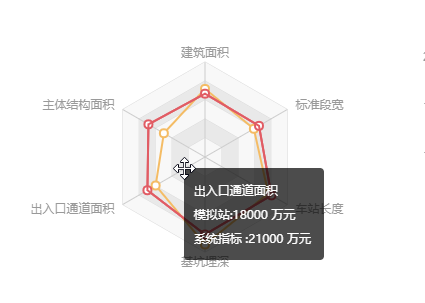
echart:雷达图
radarChartOption = { title : { // text: '清单费用构成', textStyle:{ fontWeight:'normal', fontSize:'14', color:'#666' }, x:'center', y:'15' }, tooltip : { trigger: 'axis', padding:10, formatter:function(params){ var data = ''; $.each(params,function (index,item) { data += item.name+':'+item.value+' 万元 '+ '<br/>'; }); return params[0].indicator+'<br/>'+data; } }, polar : [ { radius:95, //半径 center:['50%','50%'], // 图的位置 name:{ // show: true, // 是否文字 // formatter: null, // 文字的显示形式 textStyle: { color:'#999' // 文字颜色 } }, indicator : [ { text: '建筑面积', max: 6000}, { text: '主体结构面积', max: 16000}, { text: '出入口通道面积', max: 30000}, { text: '基坑埋深', max: 38000}, { text: '车站长度', max: 52000}, { text: '标准段宽', max: 32000} ], splitArea : { show : true, areaStyle : { color: ["#f8f8f8","#e9e9e9"] // 图表背景网格区域的颜色 } }, splitLine : { show : true, lineStyle : { width : 1, color : '#dbdbdb' // 图表背景网格线的颜色 } } } ], calculable : true, series : [ { name: '', type: 'radar', symbol:'emptyCircle', /*曲线圆点*/ symbolSize:4, data : [ { value : [4300, 8000, 18000, 35000, 40000, 19000,18000], name: '模拟站', totalNumber:1000, itemStyle: { normal: { color : "#f4bc65" // 图表中各个图区域的边框线颜色 } } }, { value : [4000, 11000, 21000, 31000, 42000, 21000,11000], name: '系统指标 ', totalNumber:1000, itemStyle: { normal: { color : "#e15c64" // 图表中各个图区域的边框线拐点颜色 } } } ] } ] };
附图:

版权声明:本文为caiyongshengCSDN原创文章,遵循 CC 4.0 BY-SA 版权协议,转载请附上原文出处链接和本声明。