前言
- 本篇主要介绍如何读取edf脑电数据
一、什么是EDF?
-
EDF:
全称是 European Data Format(欧洲数据格式),是一种标准文件格式,用于交换和存储医疗时间序列,其能够存储多通道的数据,允许每个信号拥有不同的采样频率。所以,EDF 也是多导睡眠图(PSG)录音的流行格式。 - EDF的扩展名为EDF +,与EDF基本兼容:所有现有的EDF阅读器也显示EDF +信号;
-
EDF +:
可存储任何医疗记录
,如肌电图,诱发电位,心电图,以及自动和手动分析结果,如δ图,QRS参数和睡眠阶段。
脑电其它常用格式:
心理学MATLAB初学者教程 – 脑电数据读取
二、处理EDF文件
1. 软件读取EDF
常见的读取 EDF 文件的软件有以下几种:
使用EDFbrowser示例(效果如下图所示,还能像视频一样播放):

2. Python 读写EDF
2.1 使用MNE
-
内容详见:
MNE-python读取.edf文件
2.2 使用Pyedflib
-
源码:
官网下载示例
-
解析:
- 读取文件示例:
import numpy as np
import pyedflib


def read_edf(file):
    f = pyedflib.EdfReader(file)
    print("\nlibrary version: %s" % pyedflib.version.version)

    print("\ngeneral header:\n")
    print("edfsignals: %i" % f.signals_in_file)
    print("file duration: %i seconds" % f.file_duration)
    print("startdate: %i-%i-%i" %
          (f.getStartdatetime().day, f.getStartdatetime().month,
           f.getStartdatetime().year))
    print("starttime: %i:%02i:%02i" %
          (f.getStartdatetime().hour, f.getStartdatetime().minute,
           f.getStartdatetime().second))
    print("recording: %s" % f.getPatientAdditional())
    print("patientcode: %s" % f.getPatientCode())
    print("gender: %s" % f.getGender())
    print("birthdate: %s" % f.getBirthdate())
    print("patient_name: %s" % f.getPatientName().encode('ascii').decode('unicode_escape'))
    print("patient_additional: %s" % f.getPatientAdditional())
    print("admincode: %s" % f.getAdmincode())
    print("technician: %s" % f.getTechnician())
    print("equipment: %s" % f.getEquipment())
    print("recording_additional: %s" % f.getRecordingAdditional())
    print("datarecord duration: %f seconds" % f.getFileDuration())
    print("number of datarecords in the file: %i" % f.datarecords_in_file)
    print("number of annotations in the file: %i" % f.annotations_in_file)

    channel = 3
    print("\nsignal parameters for the %d.channel:\n\n" % channel)

    print("label: %s" % f.getLabel(channel))
    print("samples in file: %i" % f.getNSamples()[channel])
    # print("samples in datarecord: %i" % f.get
    print("physical maximum: %f" % f.getPhysicalMaximum(channel))
    print("physical minimum: %f" % f.getPhysicalMinimum(channel))
    print("digital maximum: %i" % f.getDigitalMaximum(channel))
    print("digital minimum: %i" % f.getDigitalMinimum(channel))
    print("physical dimension: %s" % f.getPhysicalDimension(channel))
    print("prefilter: %s" % f.getPrefilter(channel))
    print("transducer: %s" % f.getTransducer(channel))
    print("samplefrequency: %f" % f.getSampleFrequency(channel))

    annotations = f.readAnnotations()
    for n in np.arange(f.annotations_in_file):
        print(
            "annotation: onset is %f    duration is %s    description is %s" %
            (annotations[0][n], annotations[1][n], annotations[2][n]))

    buf = f.readSignal(channel)
    n = 200
    print("\nread %i samples\n" % n)
    result = ""
    for i in np.arange(n):
        result += ("%.1f, " % buf[i])
    print(result)
    f.close()
    del f


if __name__ == "__main__":

    demofilepath = 'demo_write.edf'
    read_edf(demofilepath)
运行结果:
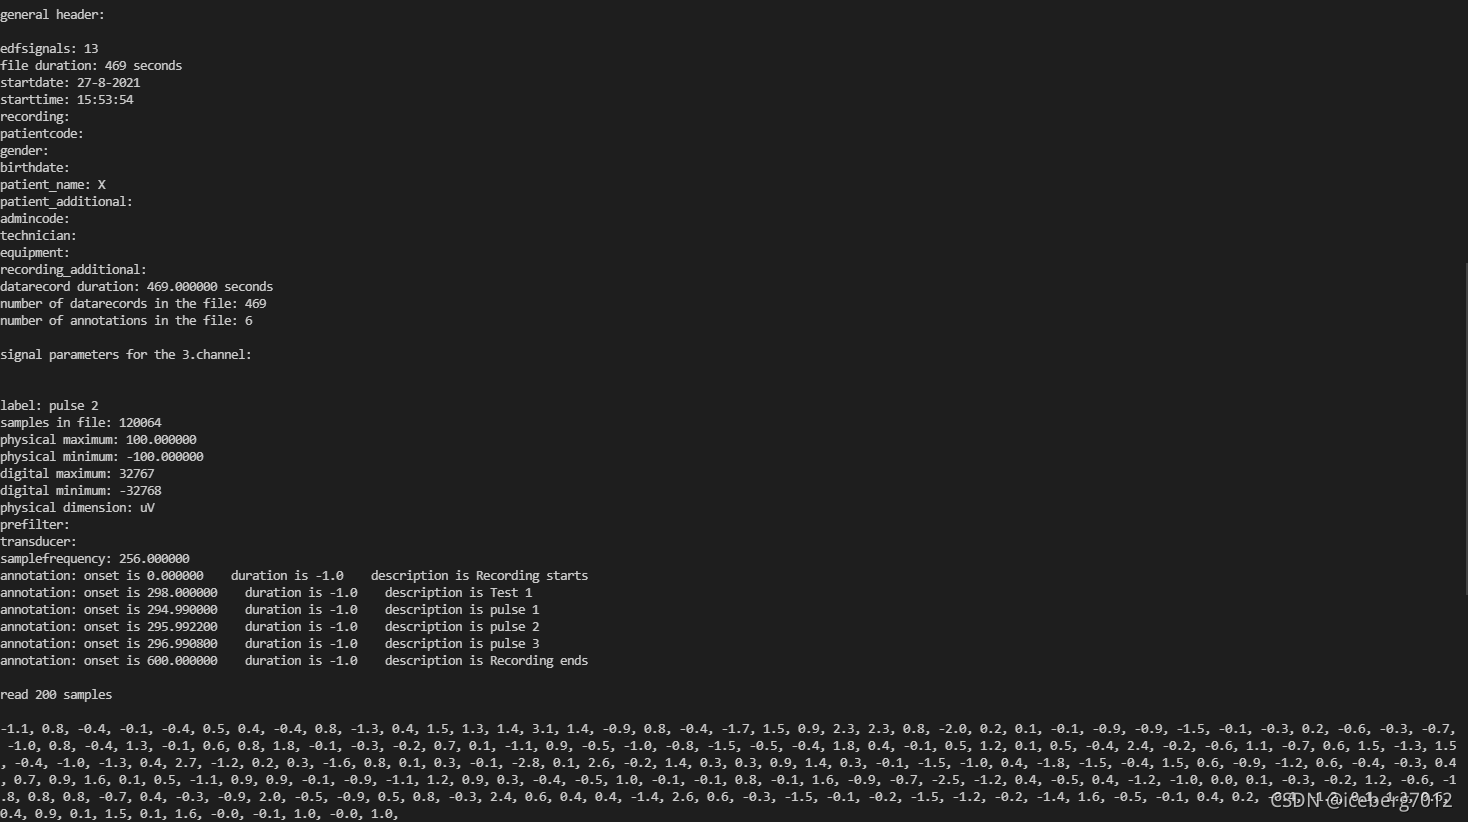
- 写入文件示例:(创建名为demo_write的EDF文件,另:可能是版本的关系,源码中的sample_frequency需修改为sample_rate)
import numpy as np
import pyedflib

# signal label/waveform  amplitude    f       sf
# ---------------------------------------------------
#    1    squarewave        100 uV    0.1Hz   200 Hz
#    2    ramp              100 uV    1 Hz    200 Hz
#    3    pulse 1           100 uV    1 Hz    200 Hz
#    4    pulse 2           100 uV    1 Hz    256 Hz
#    5    pulse 3           100 uV    1 Hz    217 Hz
#    6    noise             100 uV    - Hz    200 Hz
#    7    sine 1 Hz         100 uV    1 Hz    200 Hz
#    8    sine 8 Hz         100 uV    8 Hz    200 Hz
#    9    sine 8.1777 Hz    100 uV    8.25 Hz 200 Hz
#    10    sine 8.5 Hz       100 uV    8.5Hz   200 Hz
#    11    sine 15 Hz        100 uV   15 Hz    200 Hz
#    12    sine 17 Hz        100 uV   17 Hz    200 Hz
#    13    sine 50 Hz        100 uV   50 Hz    200 Hz


def write_edf(file, channel):
    file_duration = 600
    f = pyedflib.EdfWriter(file,
                           channel,
                           file_type=pyedflib.FILETYPE_EDFPLUS)
    channel_info = []
    data_list = []

    ch_dict = {
        'label': 'squarewave',
        'dimension': 'uV',
        'sample_rate': 200,
        'physical_max': 100,
        'physical_min': -100,
        'digital_max': 32767,
        'digital_min': -32768,
        'transducer': '',
        'prefilter': ''
    }
    channel_info.append(ch_dict)
    data_list.append(np.random.normal(size=file_duration * 200))

    ch_dict = {
        'label': 'ramp',
        'dimension': 'uV',
        'sample_rate': 200,
        'physical_max': 100,
        'physical_min': -100,
        'digital_max': 32767,
        'digital_min': -32768,
        'transducer': '',
        'prefilter': ''
    }
    channel_info.append(ch_dict)
    data_list.append(np.random.normal(size=file_duration * 200))

    ch_dict = {
        'label': 'pulse 1',
        'dimension': 'uV',
        'sample_rate': 200,
        'physical_max': 100,
        'physical_min': -100,
        'digital_max': 32767,
        'digital_min': -32768,
        'transducer': '',
        'prefilter': ''
    }
    channel_info.append(ch_dict)
    data_list.append(np.random.normal(size=file_duration * 200))

    ch_dict = {
        'label': 'pulse 2',
        'dimension': 'uV',
        'sample_rate': 256,
        'physical_max': 100,
        'physical_min': -100,
        'digital_max': 32767,
        'digital_min': -32768,
        'transducer': '',
        'prefilter': ''
    }
    channel_info.append(ch_dict)
    data_list.append(np.random.normal(size=file_duration * 200))

    ch_dict = {
        'label': 'pulse 3',
        'dimension': 'uV',
        'sample_rate': 217,
        'physical_max': 100,
        'physical_min': -100,
        'digital_max': 32767,
        'digital_min': -32768,
        'transducer': '',
        'prefilter': ''
    }
    channel_info.append(ch_dict)
    data_list.append(np.random.normal(size=file_duration * 200))

    ch_dict = {
        'label': 'noise',
        'dimension': 'uV',
        'sample_rate': 200,
        'physical_max': 100,
        'physical_min': -100,
        'digital_max': 32767,
        'digital_min': -32768,
        'transducer': '',
        'prefilter': ''
    }
    channel_info.append(ch_dict)
    data_list.append(np.random.normal(size=file_duration * 200))

    ch_dict = {
        'label': 'sine 1 Hz',
        'dimension': 'uV',
        'sample_rate': 200,
        'physical_max': 100,
        'physical_min': -100,
        'digital_max': 32767,
        'digital_min': -32768,
        'transducer': '',
        'prefilter': ''
    }
    channel_info.append(ch_dict)
    data_list.append(np.random.normal(size=file_duration * 200))

    ch_dict = {
        'label': 'sine 8 Hz',
        'dimension': 'uV',
        'sample_rate': 200,
        'physical_max': 100,
        'physical_min': -100,
        'digital_max': 32767,
        'digital_min': -32768,
        'transducer': '',
        'prefilter': ''
    }
    channel_info.append(ch_dict)
    data_list.append(np.random.normal(size=file_duration * 200))

    ch_dict = {
        'label': 'sine 8.1777 Hz',
        'dimension': 'uV',
        'sample_rate': 200,
        'physical_max': 100,
        'physical_min': -100,
        'digital_max': 32767,
        'digital_min': -32768,
        'transducer': '',
        'prefilter': ''
    }
    channel_info.append(ch_dict)
    data_list.append(np.random.normal(size=file_duration * 200))

    ch_dict = {
        'label': 'sine 8.5 Hz',
        'dimension': 'uV',
        'sample_rate': 200,
        'physical_max': 100,
        'physical_min': -100,
        'digital_max': 32767,
        'digital_min': -32768,
        'transducer': '',
        'prefilter': ''
    }
    channel_info.append(ch_dict)
    data_list.append(np.random.normal(size=file_duration * 200))

    ch_dict = {
        'label': 'sine 15 Hz',
        'dimension': 'uV',
        'sample_rate': 200,
        'physical_max': 100,
        'physical_min': -100,
        'digital_max': 32767,
        'digital_min': -32768,
        'transducer': '',
        'prefilter': ''
    }
    channel_info.append(ch_dict)
    data_list.append(np.random.normal(size=file_duration * 200))

    ch_dict = {
        'label': 'sine 17 Hz',
        'dimension': 'uV',
        'sample_rate': 200,
        'physical_max': 100,
        'physical_min': -100,
        'digital_max': 32767,
        'digital_min': -32768,
        'transducer': '',
        'prefilter': ''
    }
    channel_info.append(ch_dict)
    data_list.append(np.random.normal(size=file_duration * 200))

    ch_dict = {
        'label': 'sine 50 Hz',
        'dimension': 'uV',
        'sample_rate': 200,
        'physical_max': 100,
        'physical_min': -100,
        'digital_max': 32767,
        'digital_min': -32768,
        'transducer': '',
        'prefilter': ''
    }
    channel_info.append(ch_dict)
    data_list.append(np.random.normal(size=file_duration * 200))

    f.setSignalHeaders(channel_info)
    f.writeSamples(data_list)
    f.writeAnnotation(0, -1, "Recording starts")
    f.writeAnnotation(298, -1, "Test 1")
    f.writeAnnotation(294.99, -1, "pulse 1")
    f.writeAnnotation(295.9921875, -1, "pulse 2")
    f.writeAnnotation(296.99078341013825, -1, "pulse 3")
    f.writeAnnotation(600, -1, "Recording ends")
    f.close()
    del f


if __name__ == "__main__":

    demofilepath = 'demo_write.edf'
    write_edf(demofilepath, 13)   # 创建写edf样本
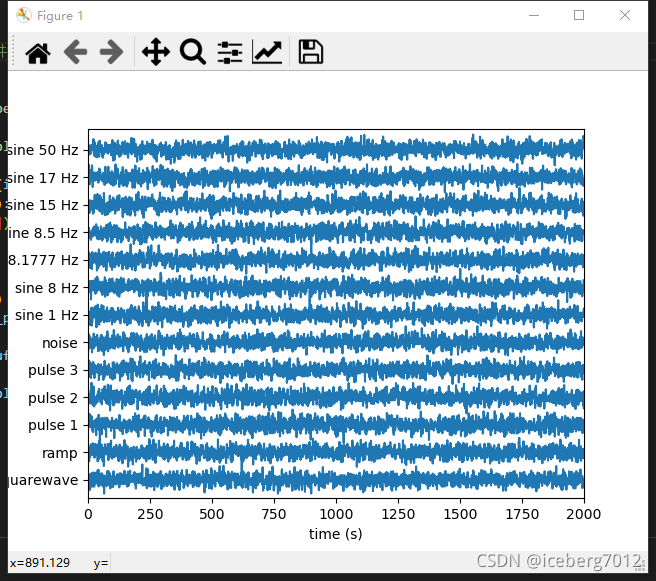
- 绘图示例:
# based on multilineplot example in matplotlib with MRI data (I think)
# uses line collections (might actually be from pbrain example)
# clm

import numpy as np
import matplotlib.pyplot as plt
from matplotlib.collections import LineCollection
import pyedflib


def stackplot(marray, seconds=None, start_time=None, ylabels=None, ax=None):
    """
    will plot a stack of traces one above the other assuming
    marray.shape = numRows, numSamples
    """
    tarray = np.transpose(marray)
    stackplot_t(tarray,
                seconds=seconds,
                start_time=start_time,
                ylabels=ylabels,
                ax=ax)
    plt.show()


def stackplot_t(tarray, seconds=None, start_time=None, ylabels=None, ax=None):
    """
    will plot a stack of traces one above the other assuming
    tarray.shape =  numSamples, numRows
    """
    data = tarray
    numSamples, numRows = tarray.shape
    # data = np.random.randn(numSamples,numRows) # test data
    # data.shape = numSamples, numRows
    if seconds:
        t = seconds * np.arange(numSamples, dtype=float) / numSamples
        # import pdb
        # pdb.set_trace()
        if start_time:
            t = t + start_time
            xlm = (start_time, start_time + seconds)
        else:
            xlm = (0, seconds)

    else:
        t = np.arange(numSamples, dtype=float)
        xlm = (0, numSamples)

    ticklocs = []
    if ax is None:
        ax = plt.subplot(111)
    plt.xlim(*xlm)
    # xticks(np.linspace(xlm, 10))
    dmin = data.min()
    dmax = data.max()
    dr = (dmax - dmin) * 0.7  # Crowd them a bit.
    y0 = dmin
    y1 = (numRows - 1) * dr + dmax
    plt.ylim(y0, y1)

    segs = []
    for i in range(numRows):
        segs.append(np.hstack((t[:, np.newaxis], data[:, i, np.newaxis])))
        # print "segs[-1].shape:", segs[-1].shape
        ticklocs.append(i * dr)

    offsets = np.zeros((numRows, 2), dtype=float)
    offsets[:, 1] = ticklocs

    lines = LineCollection(
        segs,
        offsets=offsets,
        transOffset=None,
    )

    ax.add_collection(lines)

    # set the yticks to use axes coords on the y axis
    ax.set_yticks(ticklocs)
    # ax.set_yticklabels(['PG3', 'PG5', 'PG7', 'PG9'])
    # if not plt.ylabels:
    plt.ylabels = ["%d" % ii for ii in range(numRows)]
    ax.set_yticklabels(ylabels)

    plt.xlabel('time (s)')


def test_stacklineplot():
    numSamples, numRows = 800, 5
    data = np.random.randn(numRows, numSamples)  # test data
    stackplot(data, 10.0)


if __name__ == "__main__":
    file = 'demo_write.edf'  # 文件路径
    f = pyedflib.EdfReader(file)
    n = f.signals_in_file
    signal_labels = f.getSignalLabels()
    n_min = f.getNSamples()[0]
    sigbufs = [np.zeros(f.getNSamples()[i]) for i in np.arange(n)]
    for i in np.arange(n):
        sigbufs[i] = f.readSignal(i)
        if n_min < len(sigbufs[i]):
            n_min = len(sigbufs[i])
    f._close()
    del f

    n_plot = np.min((n_min, 2000))
    sigbufs_plot = np.zeros((n, n_plot))
    for i in np.arange(n):
        sigbufs_plot[i, :] = sigbufs[i][:n_plot]

    stackplot(sigbufs_plot[:, :n_plot], ylabels=signal_labels)
运行结果:
3. C/C++ 读写EDF
本文参考来源:
版权声明:本文为iceberg7012原创文章,遵循 CC 4.0 BY-SA 版权协议,转载请附上原文出处链接和本声明。