文章目录
1.matpltlib
分为直接绘图与面向对象绘图两种方式
(1)直接绘图
from matplotlib import pyplot as plt
#matplotlib绘图的两种方式
x = [-3, 5, 7]
y = [10, 2, 5]

#画布
plt.figure(figsize=(15,3))
#plot 画图
plt.plot(x,y)
#设置x轴和y轴的取值范围
plt.ylim(0,10)
plt.xlim(-3,8)

#设置标签
plt.xlabel('X Axis',size =20)
plt.ylabel('Y Axis',size =20)

#设置标题
plt.title('Line',size=20)

plt.show
[外链图片转存失败,源站可能有防盗链机制,建议将图片保存下来直接上传(img-cqo87qMc-1689681389506)(https://wckdhr12.oss-cn-chengdu.aliyuncs.com/image-20230718153656773.png)]
(2)面向对象绘图
#第二种:面向对象
#matplotlib绘图的两种方式
x = [-3, 5, 7]
y = [10, 2, 5]

#创建一个图,并且图上有一个坐标系
fig,ax = plt.subplots(figsize=(15,3)) #fig代表图  ax代表坐标系

#进行绘图
ax.plot(x,y)
#设置坐标轴
ax.set_xlim(-3,8)
ax.set_ylim(0,10)
ax.set_xlabel('X Axis',size=12)
ax.set_ylabel('Y Axis',size=12)
ax.set_title('Line',size=20)
plt.show()
fig代表图,ax代表坐标轴,传值不懂的话可以看一下面向对象

(3)组合图
组合图
fig = plt.figure(figsize=(16,8))
#添加四个坐标系
axes1 = fig.add_subplot(2,2,1)
axes2 = fig.add_subplot(2,2,2)
axes3 = fig.add_subplot(2,2,3)
axes4 = fig.add_subplot(2,2,4)

#画图
axes1.plot(x,y,'o')#o为描点
axes2.plot(x,y)
axes3.plot(x,y)
axes4.plot(x,y)
#设置标题
axes1.set_title('1')

#设置画布标题
fig.suptitle('%pinfocture')
[外链图片转存失败,源站可能有防盗链机制,建议将图片保存下来直接上传(img-SszavQjL-1689681389507)(https://wckdhr12.oss-cn-chengdu.aliyuncs.com/image-20230718154052467.png)]
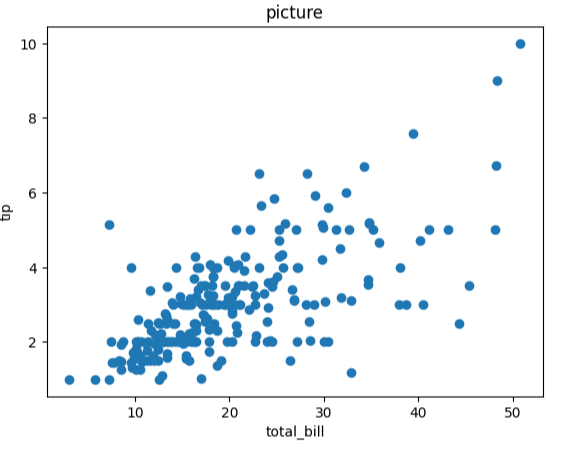
(4)散点图
#双变量绘图
#1.散点图
#导入数据
import seaborn as sns
tips = sns.load_dataset('tips')

#设置画板
fig = plt.figure()
ax = fig.add_subplot(1,1,1)

#画图
ax.scatter(tips['total_bill'],tips['tip'])
#设置标题
ax.set_xlabel('total_bill')
ax.set_ylabel('tip')
ax.set_title('picture')
(5)多变量绘图
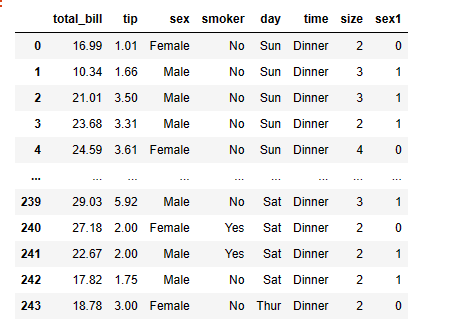
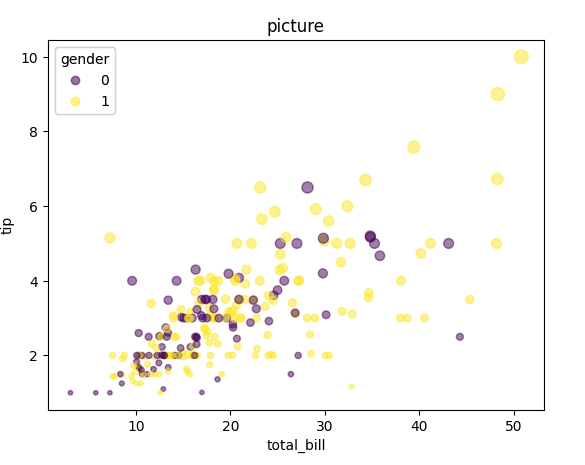
先说一下资料背景,我想看一下tips中total_bill,tips之间的关系。现在我想看他俩之间的关系是否和性别有关,因此我需要把sex列变为01(如图sex1)的形式。不同性别用不同颜色进行表示。
开始画图
#2.画图
fig = plt.figure()
ax = fig.add_subplot(1,1,1)

scatter = ax.scatter(x=tips['total_bill'],y=tips['tip'],s=tips['tip']*10,c=tips['sex1'],alpha=0.5)#c是颜色,s是点的大小
#设置标题
ax.set_xlabel('total_bill')
ax.set_ylabel('tip')
ax.set_title('picture')
#添加图例
legend = ax.legend(*scatter.legend_elements(),title='gender')
ax.add_artist(legend)
散点图里的s是指的点的大小,c是颜色
2.pandas 画图
(1)导入数据
reviews = pd.read_csv(r'D:\python\env\virtual operation\数据分析\data\winemag-data_first150k.csv',index_col=0)
reviews.head()

(2)柱状图
#柱状图
#导入数据
reviews = pd.read_csv(r'D:\python\env\virtual operation\数据分析\data\winemag-data_first150k.csv',index_col=0)
reviews.head()

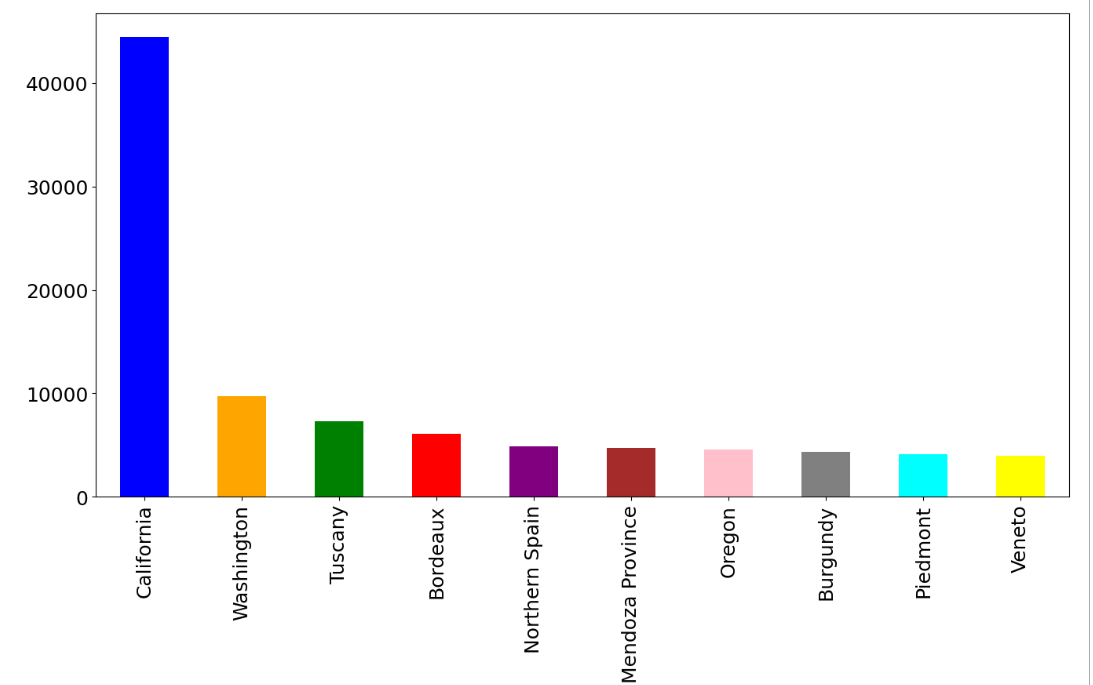
#目标:统计生产葡萄酒最多的10个产区
#准备绘图参数
text_kwargs = dict(figsize = (16,8),
                   fontsize = 18,
                   color = ['b','orange','g','r','purple','brown','pink','gray','cyan','yellow']

)
reviews['province'].value_counts().head(10).plot.bar(**text_kwargs) #统计每个地区出现的次数
这里需要注意的函数是==value_counts,==这个是统计每列中变量出现的个数
reviews['points'].value_counts().sort_index().plot.bar(**text_kwargs)

(3)折线图
#折线图
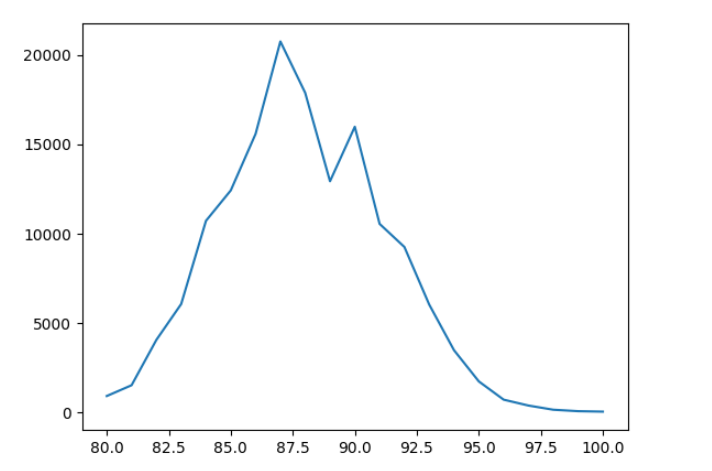
reviews['points'].value_counts().sort_index().plot.line()
(4)折线图
#面积图
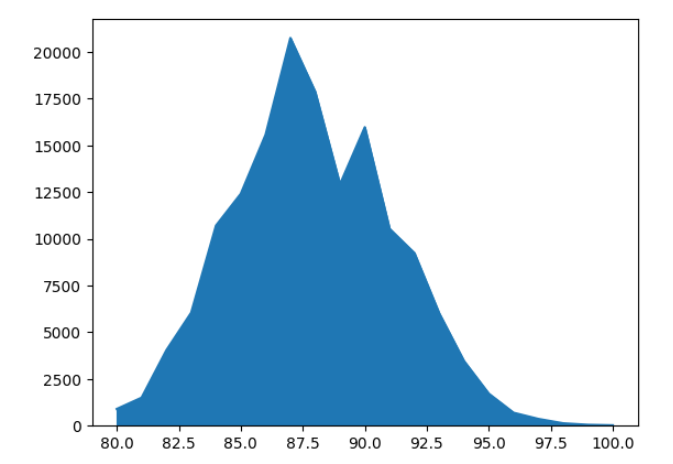
reviews['points'].value_counts().sort_index().plot.area()
(5)饼状图
#饼图
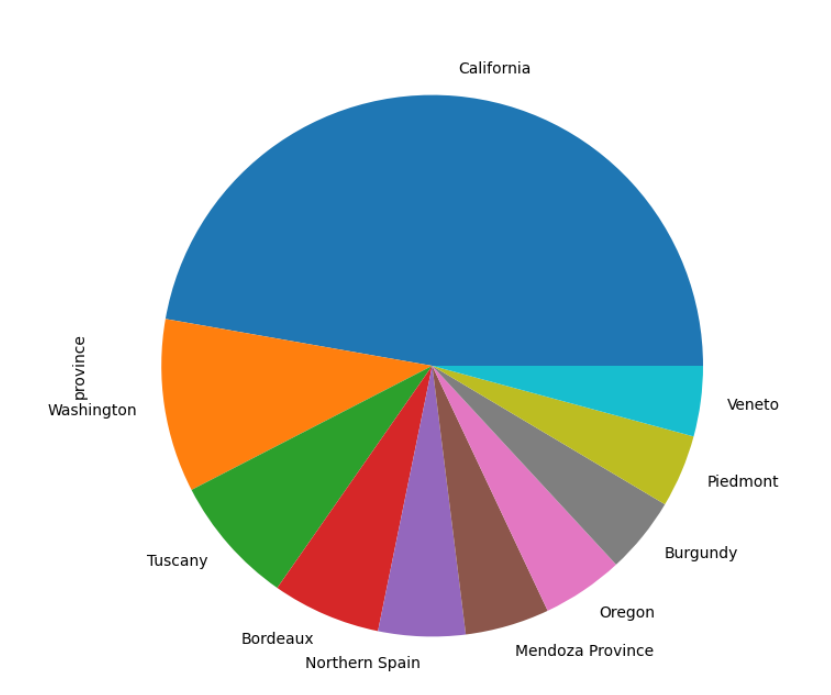
reviews['province'].value_counts().head(10).plot.pie(figsize=(20,8))
(6)散点图
#散点图
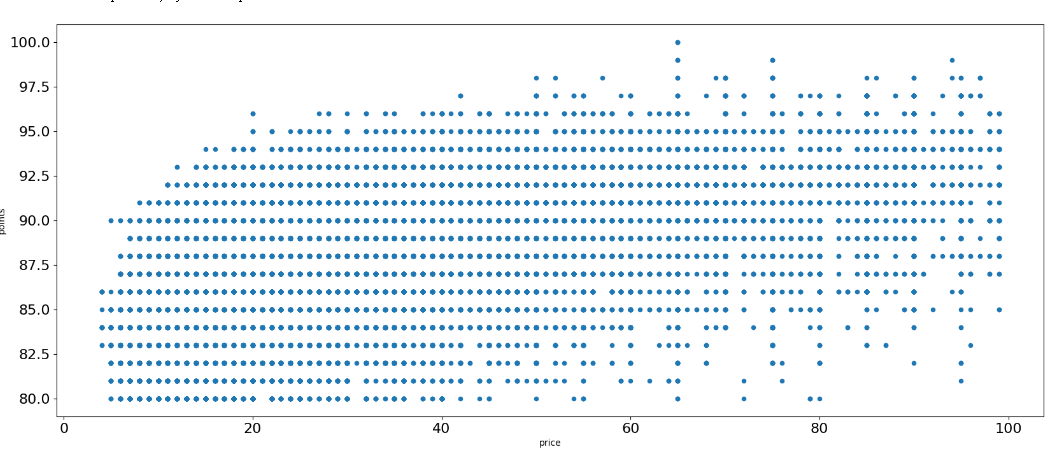
reviews[reviews['price']<100].plot.scatter(x='price',y='points',figsize=(20,8),fontsize=16)
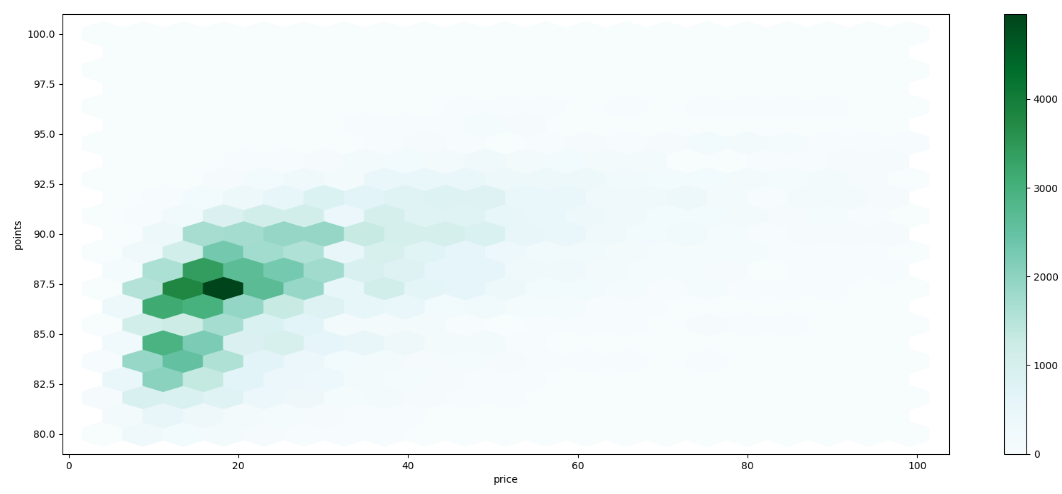
(7)蜂蜜图*(散点较多的时候)
#蜂蜜图:针对散点角度的情况hexplot
fig,axes = plt.subplots(ncols=1,figsize=(16,8))
reviews[reviews['price']<100].plot.hexbin(x='price',y='points',figsize=(20,8),gridsize=20,ax=axes)#gridsize=20表示格子的大小
(8)堆积图*
1.首先查看数量最多的5个葡萄酒
reviews.groupby('variety').country.count().sort_values(ascending=False)
2.#从数据中筛选出最常见的5中啤酒
#从数据中筛选出最常见的5中啤酒
top5 = reviews[reviews.variety.isin(['Chardonnay',
                                    'Pinot Noir',
                                    'Cabernet Sauvignon',
                                    'Red Blend',
                                    'Bordeaux-style Red Blend']
)]
top5
这个地方要注意这个函数,
isin函数可以在某列中筛选指定标签的数据
#统计每个种类葡萄酒的不同评分数量
wine_counts = top5.pivot_table(values='country',
                               index='points',
                               columns='variety',
                               aggfunc='count'
)
wine_counts
wine_counts.plot.bar(figsize=(16,8),stacked=True)
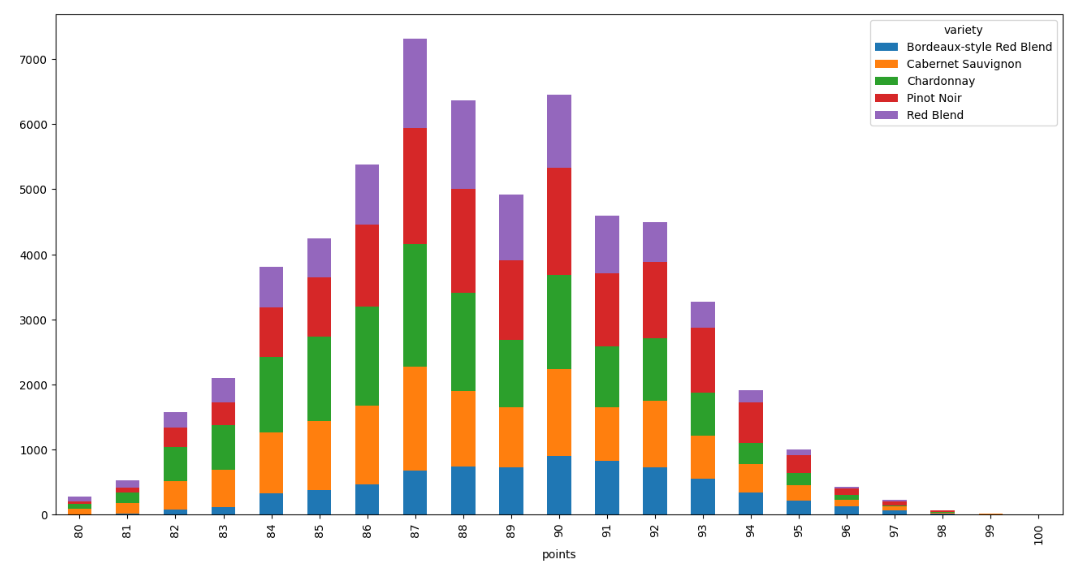
实际上就是柱状图的stacked参数发生了变化。