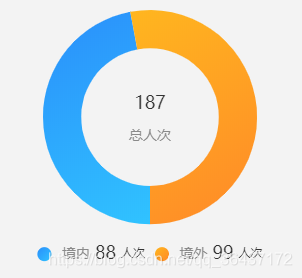
效果图如下:
主要属性说明:
{
    name: '状态',
    type: 'pie',
    radius: ['25%', '36%'],
    avoidLabelOverlap: false, // 不启用防止标签重叠策略
    startAngle: 270,          // 定义颜色渐变起始角度
    hoverAnimation: false,    // 不开启 hover 在扇区上的放大动画效果
    data: [
        {
            value: 330,
            name: '正常',
            itemStyle: {
                color: {
                    type: 'linear',
                    x: 0,
                    y: 0,
                    x2: 1,
                    y2: 1,
                    colorStops: [
                        {offset: 0, color: '#2D38FF'},
                        {offset: 1, color: '#969BFB'}
                    ],
                    globalCoord: false // 缺省为 false
                }
            },
        },
       ...
    ]
}
更多详情,请参考:
echarts 柱状图颜色设置
,对于颜色渐变的起始角度,还有渐变程度,并非直接用数字就可以直白表达出来的。
var saleAmountTotal = 88;
var saleAmountTotal2  = 99;

const { PI, cos, sin } = Math;

// 计算占比
const d_val_p = saleAmountTotal/ (saleAmountTotal+saleAmountTotal2)  * 100;
const i_val_p = saleAmountTotal2/ (saleAmountTotal+saleAmountTotal2) * 100;
// 计算圆心角
const d_angle = PI * d_val_p / 50 / 2;
const i_angle = PI * i_val_p / 50 / 2;
// 计算渐变起点和终点
const d_pointStart = [
    0.5 - 0.5 * cos(d_angle) * sin(d_angle),
    0.5 + 0.5 * cos(d_angle) * cos(d_angle)
];
const d_pointEnd = [
    0.5 - 0.5 * sin(d_angle),
    0.5 + 0.5 * cos(d_angle)
];
const i_pointStart = [
    0.5 - 0.5 * cos(i_angle) * sin(i_angle),
    0.5 + 0.5 * cos(i_angle) * cos(i_angle)
];
const i_pointEnd = [
    0.5 - 0.5 * sin(i_angle),
    0.5 + 0.5 * cos(i_angle)
];
补充:legend 文字样式
![]()
采用
rich
里面,可以自定义富文本样式。更多了解:
legend.textStyle.rich
。
legend : {
    orient : 'horizontal',
    bottom : '14%',
    data : [ '境内', '境外'],
    icon : 'circle',
    formatter : function(name) {
        var arr;
        for (let i = 0; i < data_10000002.length; i++) {
            arr = [ "{b|" + name + "}" + "{a|" + data_10000002[i].value
                + "}" + "人次" ];
        }
        return arr
    },
    textStyle : {
        color : "rgba(51, 51, 51, 1)",
        rich : {
            a : {
                fontSize : 18,
                color : "rgba(51, 51, 51, 1)",
                padding : 5
            },
            b : {
                fontSize : 14,
                color : "rgba(138, 138, 138, 1)"
            }
        }
    }
},